
Figure 3. ROC curve analysis for urinary semaphorin 3A, Netrin-1, and NGAL at 2 hours after liver transplantation.
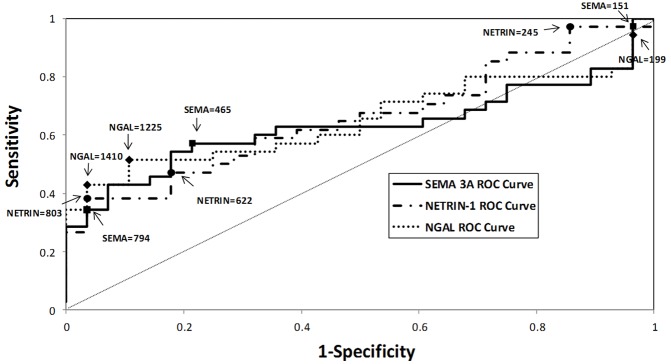
The values are urinary concentrations at 2 hours after liver transplant, which correspond to 95% sensitivity, optimal sensitivity and specificity, and 95% specificity, respectively, for each biomarker.