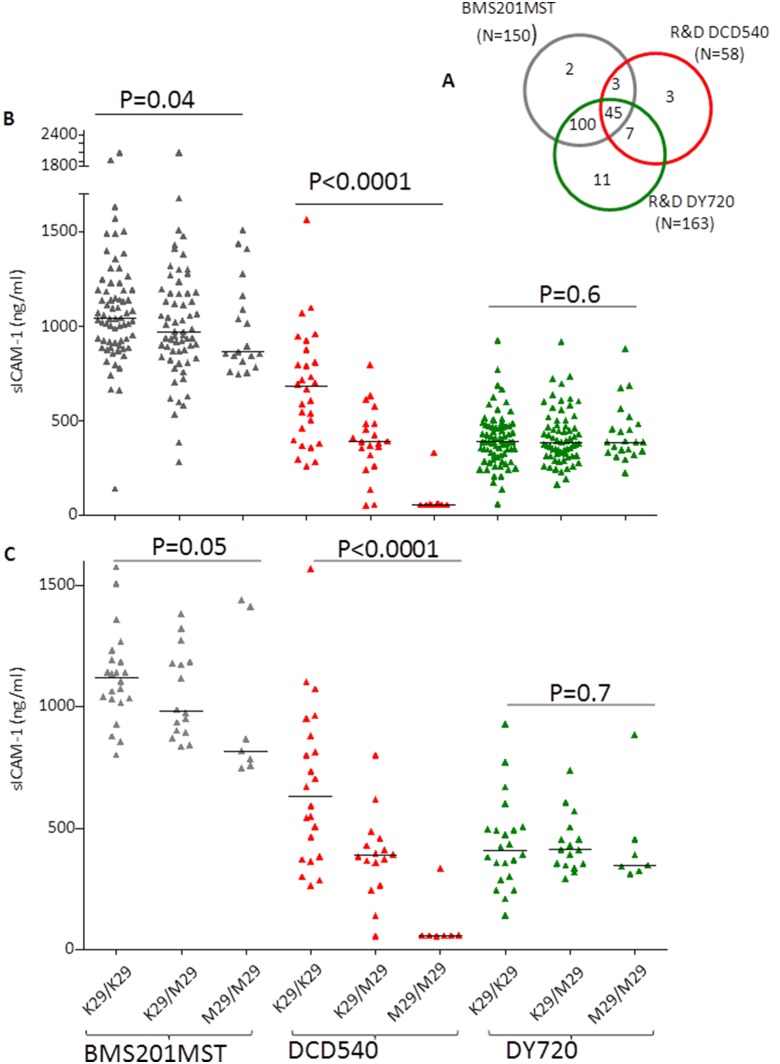
Figure 1. Plasma sICAM-1 in relation to ICAM-1kilifi genotypes.
A. Venn diagram showing the samples used in this study We measured sICAM-1 in 163, 150, and 58 samples using DY720, BMS201MST, and DCD540 ELISA kits. These samples were genotyped from ICAM-1kilifi mutation. Of these, 145 samples have been measured with both BMS201MST and R&D DY720, 52 with R&D DY720 and R&D DCD540, 48 with BMS201MST and R&D DCD540, and 45 with all the three kits. B. Plasma sICAM1 obtained with three different kits relative to ICAM-1kilifi genotypes C. Plasma sICAM-1 in a subset of 45 samples where a measure was obtained with each of the three antibodies used. Measures of plasma sICAM-1 obtained with the BMS201MST, R&D (DCD540) and R&D (DY720) antibodies are depicted in black, red and green triangles respectively. The horizontal bar indicates the median sICAM-1 value. P value was calculated using Cuzick’s test for trend.

