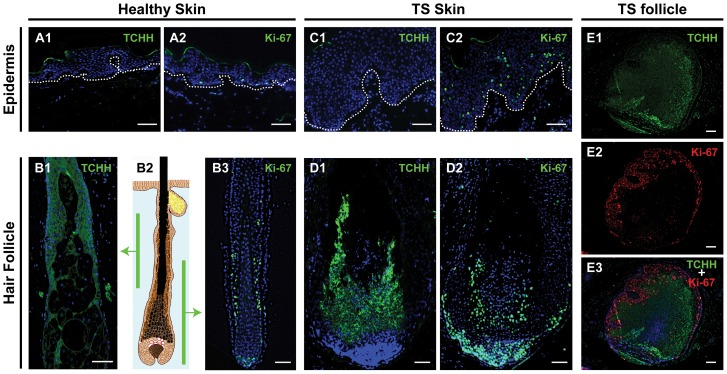
Figure 2. Trichohyalin and Ki-67 expression in healthy and lesional skin.
This figure illustrates staining of trichohyalin (TCHH) and Ki-67 in healthy (A and B) and in TS skin (C, D and E). In the left panel, trichohyalin (A1) and Ki-67 (A2) staining in healthy epidermis and in healthy hair follicles (B1 and B3) are shown, with the corresponding levels of the follicle illustrated in B2. In the middle panel, trichohyalin (TCHH) and Ki-67 staining in TS lesional skin are shown with TS epidermis on top (C1 and C2) and vertical sections of TS hair follicle beneath (D1 and D2). Dotted lines indicate the dermoepidermal junction. Costaining for trichohyalin (green) and Ki-67 (red) of a TS follicle cross-sectioned at the suprabulbar region is shown in the right panel (E1–E3). Bars depict 100 µm.

