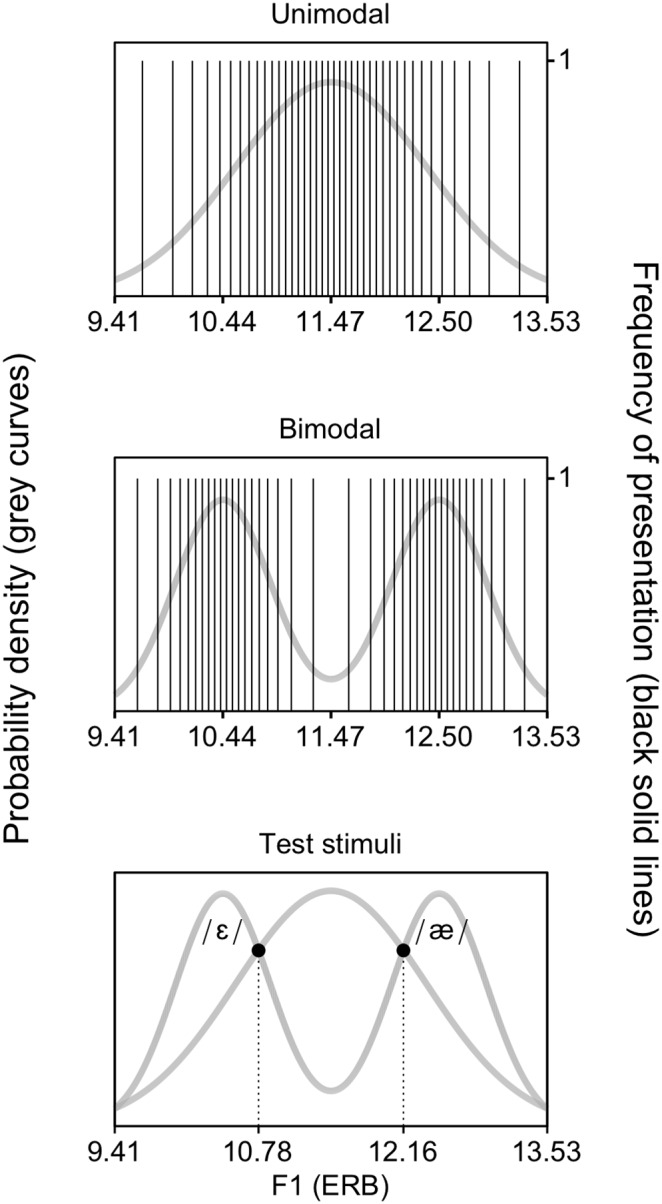
Figure 1. Distributions of first formant (F1) values (in ERB).

The unimodal (top) and bimodal (middle) distributions represent the Dutch vowel /ε/ and the English vowel contrast /ε/∼/æ/, respectively. Each solid vertical line indicates a vowel token with a specific F1 value. Each vowel token was presented only once (i.e., the height of the vertical lines is 1). The grey curves are the underlying probability density functions. When creating training distributions, the acoustic values of the test stimuli can be calculated by computing the intersections (black discs, bottom) of the unimodal and bimodal distributions.
