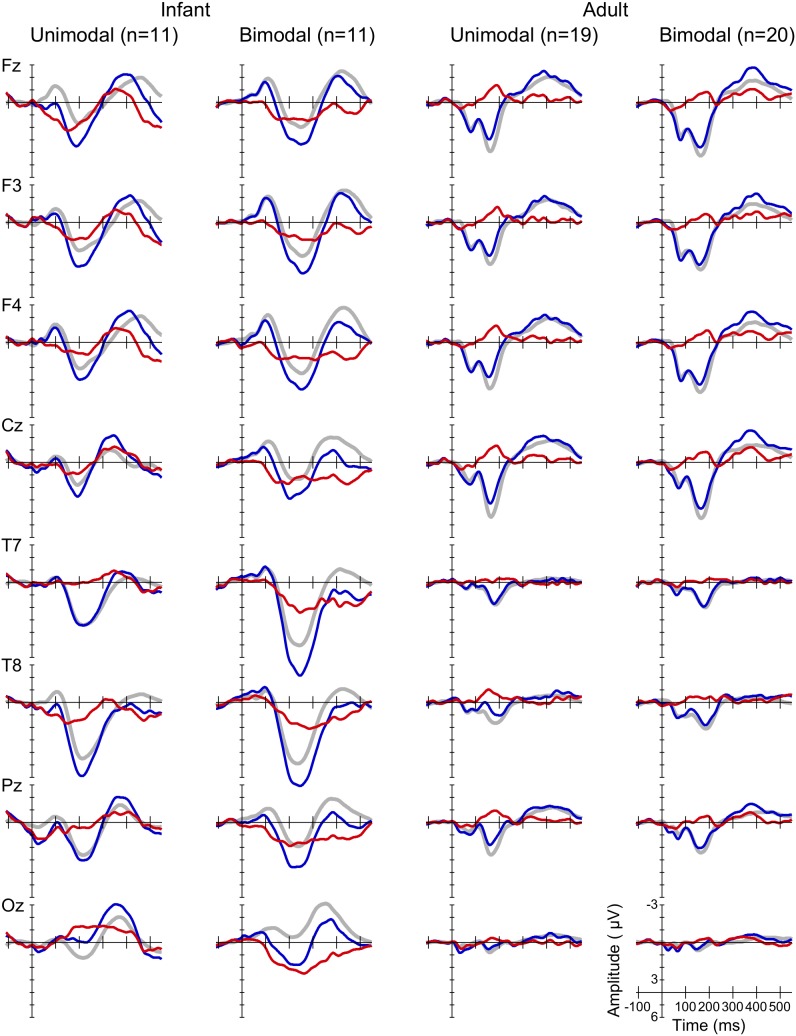
Figure 2. Grand average waveforms.
Standard (grey, thick curves), deviant (blue, thin curves) and MMR (red, thin curves), at eight electrodes (see rows), for the unimodally and bimodally trained infants in [4] (the two columns on the left) and adults in the current study (the two columns on the right).

