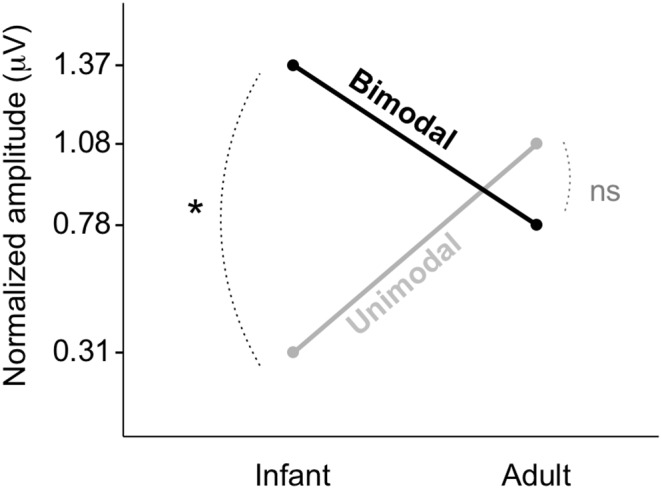
Figure 4. The interaction between Age Group and Distribution Type.

Age group: infant, left vs. adult, right. Distribution Type: unimodal, grey vs. bimodal, black.

Age group: infant, left vs. adult, right. Distribution Type: unimodal, grey vs. bimodal, black.