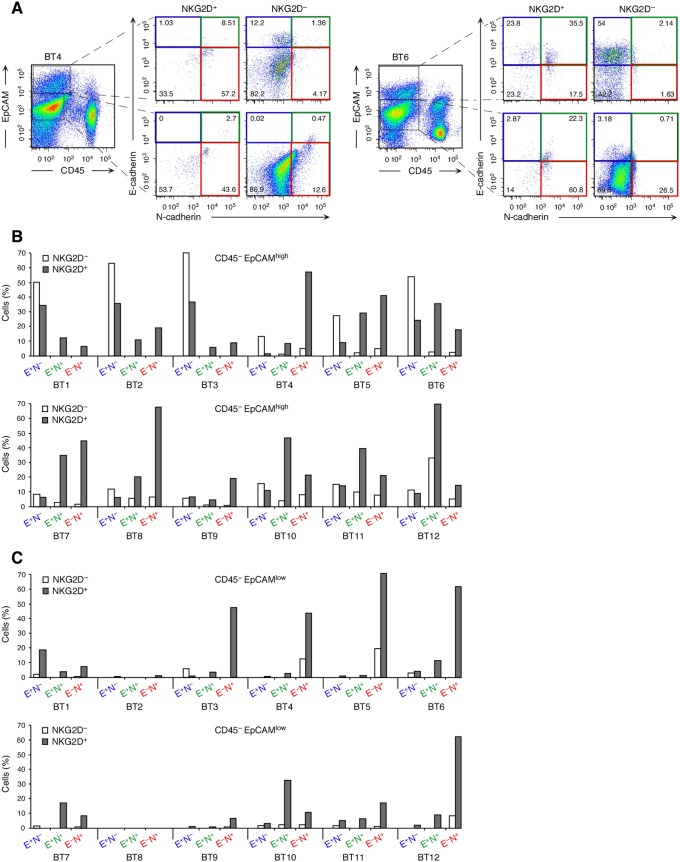
Figure 4. Association of NKG2D with hybrid and mesenchymal E-cadherin/N-cadherin signatures on ex vivo breast cancer cells and diminished expression of NKG2D ligands on EMT-transitioned cancer cells.
(A) Examples (breast cancer specimens BT4 and BT5) of multiparameter flow cytometry dot plots illustrating cancer cell gating based on absence of CD45 and presence of EpCAM (high or low) and subsequent display of E-Cadherin/N-cadherin phenotypes of NKG2D+ or NKG2D– cancer cell subsets. Numbers in quadrants indicate cell proportions in percent. Quadrant gates are based on fluorescence-minus-one isotype Ig control stainings. (B, C) Graphic display of data derived from 12 breast cancer specimens (BT1–BT12) that were analyzed as in (A). E+N–, E+N+, and E–N+ refer to E-cadherin and N-cadherin status. Colors correspond to dot plot quadrants in (A). See main text for further explanation.

