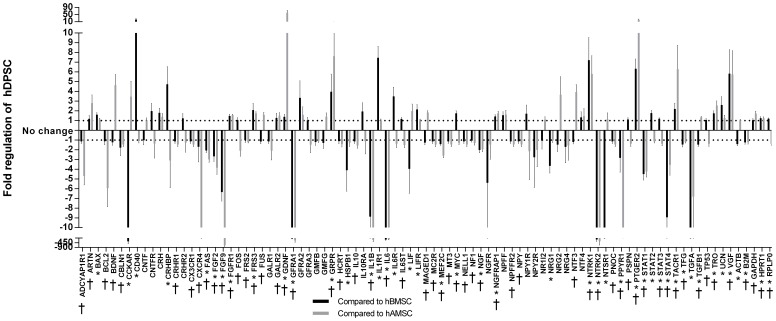
Figure 3. Expression of NTF and NTFR genes by hDPSC, hBMSC and hAMSC.
RT-PCR array analysis of 84 genes encoding NTF and NTFR expressed by hDPSC, displayed as fold regulation in comparison to either hBMSC (black bars) or hAMSC (grey bars). The horizontal dotted lines represent fold-changes of ±1 (no difference). Significant differences between hDPSC and hBMSC (*) and hDPSC and hAMSC (†) at p<0.05 are labelled on the x axis.

