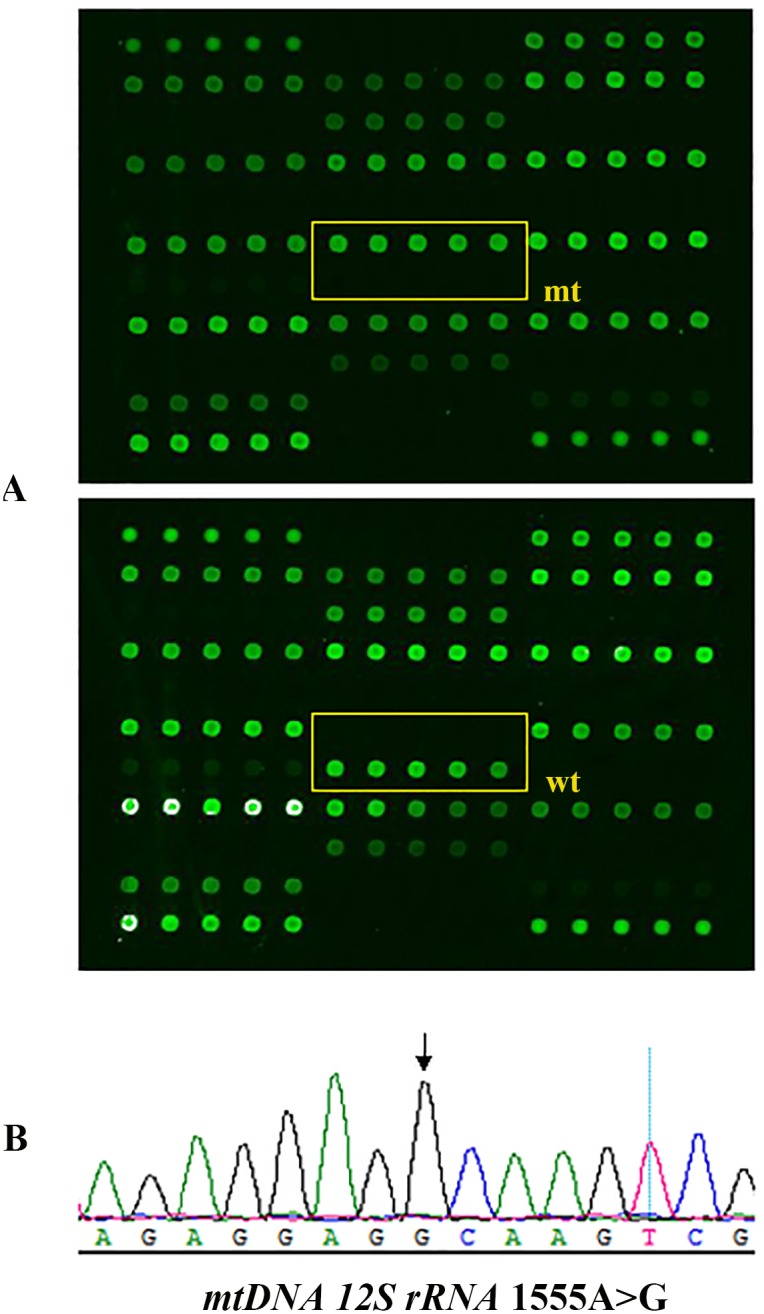
Figure 2. Deafness genes detection array.

The mtDNA 12S rRNA 1555A>G homoplasmic mutation. The box in the scanned image of the microarray chip represents the mtDNA 12S rRNA 1555A>G square areas. The upper dark dots indicate the wild-type is absent and the green dots below indicate the 1555A>G homoplasmic mutation (A). Sequence chromatograms showing the homoplasmic 1555A>G mutation as indicated by the arrow (B).
