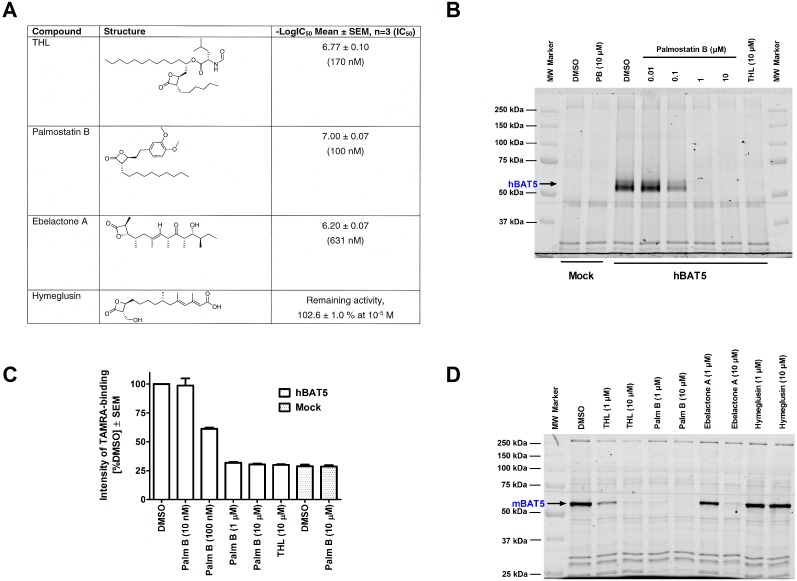
Figure 7. β-lactones as BAT5 inhibitors.
A. Potency of β-lactones to inhibit 1-LG hydrolysis in lysates of hBAT5-HEK293 cells. Lysates were treated for 30 min with the inhibitors after which glycerol generated in the hydrolysis of 1-LG (25 µM final concentration) was monitored for 90 min. Inhibitor dose–response curves and IC50 values derived thereof were calculated from non-linear regressions using GraphPad Prism 5.0 for Windows. The logIC50 values are means ± SEM from three independent experiments. IC50 values (mean) are shown in parenthesis. B–C. Competitive ABPP of hBAT5-HEK293 cell lysates showing that palmostatin B inhibits probe binding to hBAT5 with the same potency (IC50 ∼ 100 nM) as it blocks hBAT5-dependent 1-LG hydrolysis (A). C. Quantitative data (mean + SEM) on the effects of palmostatin B and THL on probe labeling of the hBAT5 band (black arrow in B). The data are derived from three separate ABPP experiments. D. Competitive ABPP demonstrating that the potency order of the β-lactones to inhibit probe binding to mBAT5 (palmostatin B > THL > ebelactone A << hymeglusin (inactive) is identical to that observed for hBAT5 (A). In B and D, lysates (25 µg) were pretreated for 1 h with DMSO or the indicated concentrations of the inhibitors, after which TAMRA-FP labelling was conducted for 1 hour at RT. The reaction was stopped, 5 µg protein was loaded per lane and the proteins separated in SDS-electrophoresis minigel (10%). TAMRA-FP labeling was visualized after in-gel fluorescence imaging as described in the Methods section. The image in D is representative from two ABPP experiments with similar outcome.

