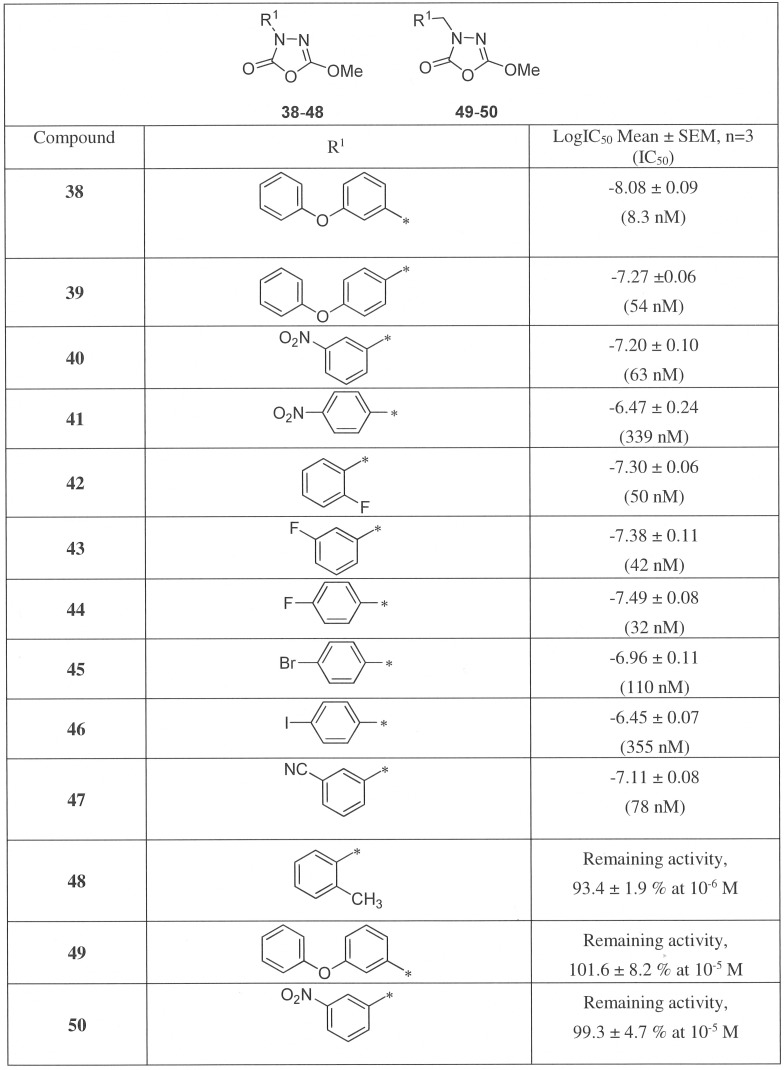
Figure 9. Inhibition of hBAT5 by phenyl and benzyl substituted 1,3,4-oxadiazol-2(3H)-ones 38–50.
Lysates of hBAT5-HEK293 cells were treated for 30 min with the inhibitors after which glycerol liberated from 1-LG hydrolysis (25 µM final concentration) was kinetically monitored for 90 min. Inhibitor dose–response curves and IC50 values derived thereof were calculated from non-linear regressions using GraphPad Prism 5.0 for Windows. Values are mean ± SEM from three independent experiments using lysates from one bacth of transfection.

