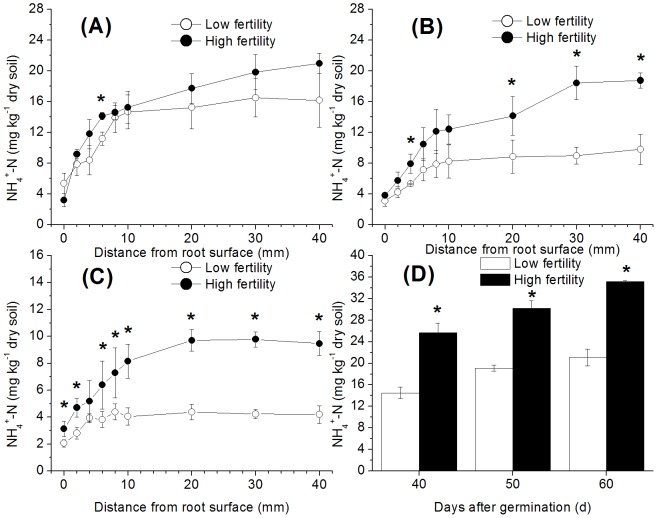
Figure 3. NH4 +-N measured at various distances from the rice root surface in paddy soils with different fertility levels (A) 40 d after germination, (B) 50 d after germination, and (C) 60 d after germination, relative to the (D) control (without rice plants).
The bars indicate ±SD. Dots and bars with * indicate a significant difference (p<0.05) between the two fertility levels.

