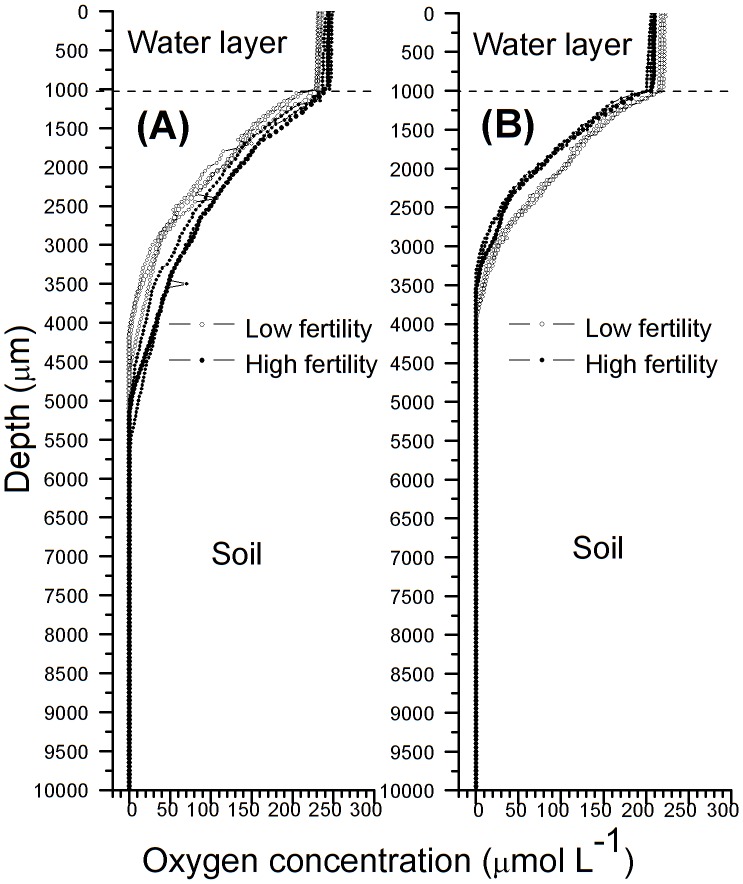
Figure 4. A representative graph showing oxygen profiles of (A) the rhizosphere soil (2 mm away from the root surface) and (B) the control (without rice plants) 50 d after germination in paddy soils with different fertility levels at 20°C.
The oxygen microelectrode used was 20–30 µm in diameter (OXY25, Unisense, Aarhus, Denmark [31]). Three rhizoboxes for each treatment were used in the in situ measurements, and the oxygen concentration profile was determined in the right and left compartments of each rhizobox. All measurements were conducted in the centre of the range marked by a 2-mm distance from the nylon nets in the low- and high-fertility soils with and without the rice plant treatments. Hence, the measurements were repeated six times in each treatment. Three results (measured in the right compartment) are shown, and each curve shows one individual soil oxygen profile.

