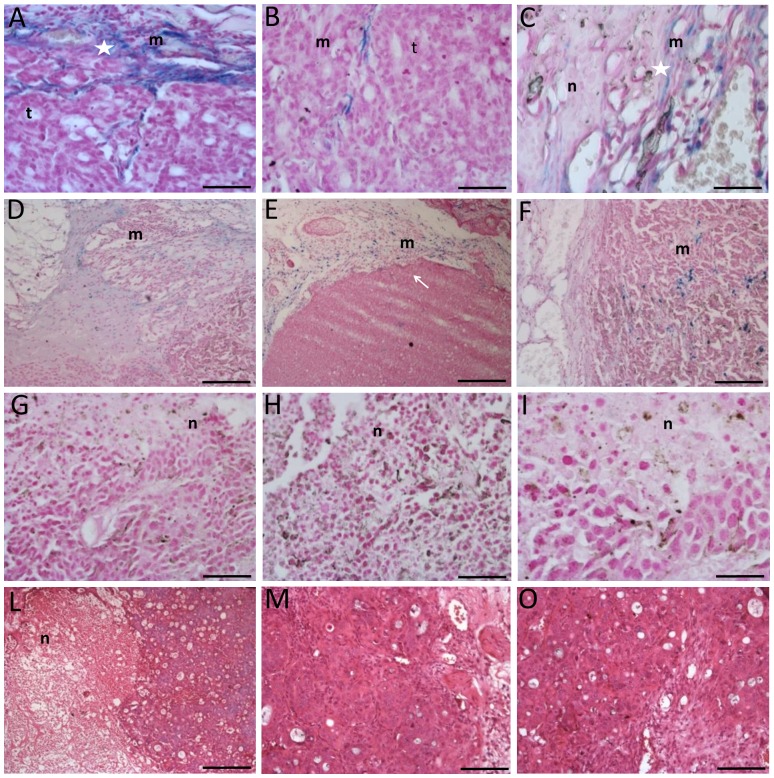
Figure 9. Histological analysis of tumors.
In the Panel A-C histology of tumor of the experimental group is showed. Injection site is showed in Panel A while in Panel B the living tumor area is illustrated. In the Panel C injured tumor area is showed. In Panel E-F histology of first subgroup of the control group is presented. In Panel G-I histology of second subgroup of the control group is presented and in the Panel L-N is showed the third subgroup of the control group. The presence of MNs depots is detectable in injection sites (A). MNs are capable to migrate and spread in tumor tissue causing the formation of fibrotic and necrotic areas (B, C). Scale bars, A-C 60 µm, D-E 300 µm, F and G 120 µm, H-I 60 µm, I 300 µm, M 120 µm, N 60 µm. Legend: m = MNs, n = necrosis and t = tumor.

