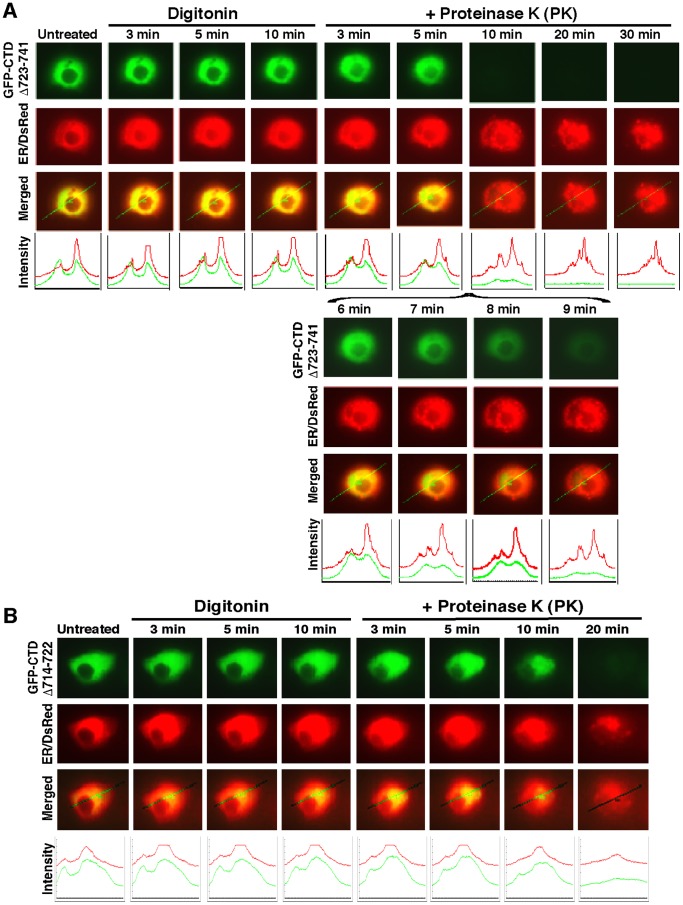
Figure 4. Live-cell imaging of both mutants GFP-CTDΔ723 −741 and GFP-CTDΔ714–722.
COS-1 cells co-expressing either GFP-CTDΔ723 −741 (A) or GFP-CTDΔ714–722 (B), along with the ER/DsRed marker, were subjected to live-cell imaging combined with the in vivo membrane protease protection assay, as described above in Figure 3. The images shown herein are a representative of at least three independent experiments undertaken on separate occasions that were each performed in triplicate (n = 9).

