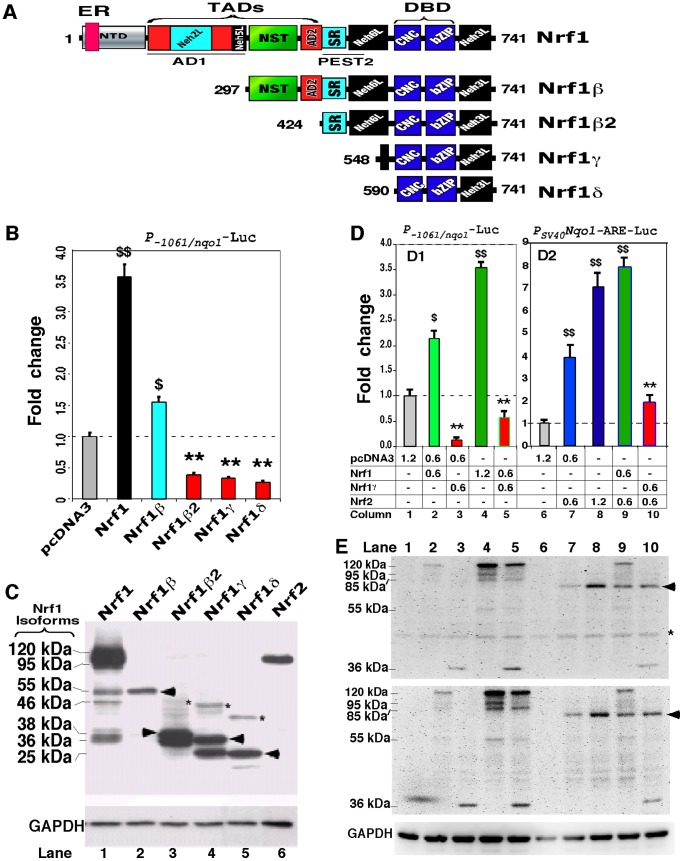
Figure 5. Opposing regulation of ARE-driven reporter genes by distinct Nrf1 isoforms.
(A) Schematic shows structural domains of five different isoforms of Nrf1. Locations of ER-targeting signal, AD1 and PEST2 are also indicated within distinct domains. (B) Shows luciferase reporter gene activity measured from COS-1 cells that had been co-transfected with 1.2 µg of each expression construct for Nrf1 isoforms, together with 0.6 µg of P-1061/nqo1-Luc (that is driven by the 1061-bp promoter of Nqo1) and 0.2 µg of β-gal plasmid. The data were calculated as a fold change (mean ± S.D) of transactivation by distinct Nrf1 isoforms. Significant increases ($, p<0.05 and $$, p<0.001, n = 9) and decreases (**, p<0.001, n = 9) in activity were calculated relatively to the background activity (obtained from transfection of cells with an empty pcDNA3 with reporter plasmids). (C) Total lysates of COS-1 cells expressing each of Nrf1 isoforms or Nrf2 were resolved by 12% SDS-PAGE in a Bis-Tris buffer system and visualized by immunoblotting with the V5 antibody. The position of migration of the V5-tagged polypeptide was estimated to be 120, 95, 55, 46, 38, 36 and 25 kDa, and GAPDH was used as an internal control to verify amounts of proteins loaded into each electrophoretic well. (D) Nrf1γ inhibits transactivation of ARE-driven genes by Nrf1 or Nrf2. COS-1 cells were co-transfected with indicated amounts of expression constructs for Nrf1, Nrf1γ and/or Nrf2, together with 0.6 µg of P-1061/nqo1-Luc (D1) or PSV40Nqo1-ARE-Luc (D2) and 0.2 µg of β-gal plasmid. Thereafter, luciferase activity was measured and is shown as a fold change (mean ± S.D). Significant increases ($, p<0.05 and $$, p<0.001, n = 9) and decreases (**, p<0.001, n = 9) in activity relatively to the background activity are indicated. (E) Total lysates of COS-1 cells co-transfected with expression constructs for Nrf1, Nrf1γ and/or Nrf2 alone or in combination (as indicated corresponding to those in panel D) was subject to separation by 4–12% LDS/NuPAGE in a Bis-Tris buffer system. The upper two panels represent similar images from different independent gels, on which location of Nrf2 migration is arrowed, whilst a non-specific protein band is starred (*). The position of the V5-tagged Nrf1 polypeptides of 120, 95, 85, 55, and 36 kDa is indicated. It is notable that the same proteins exhibit distinct mobilities on different electrophoric gels in different running buffer systems (cf. C with E).

