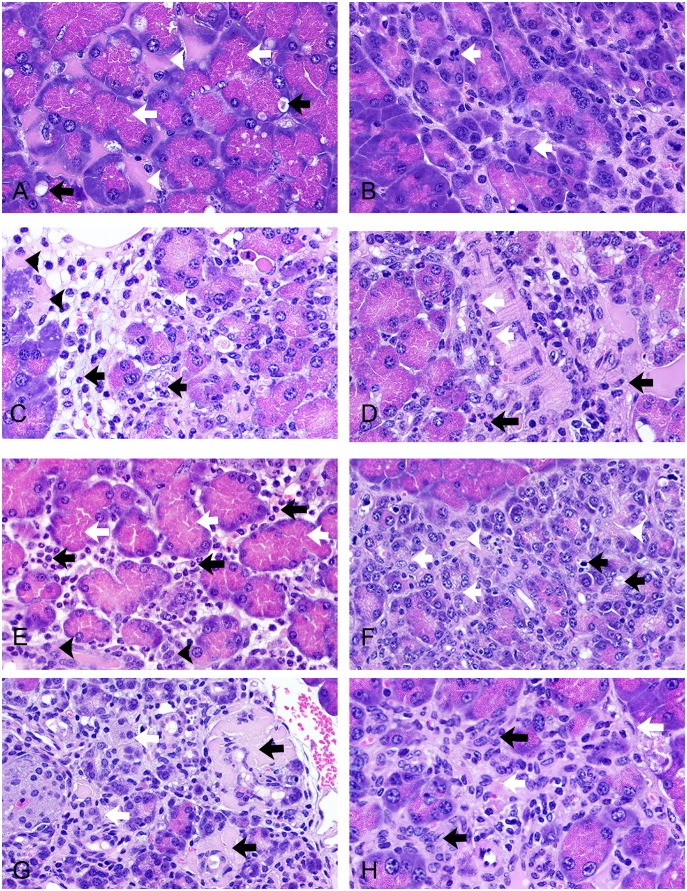
Figure 2. Representative micrographs showing range of exocrine pancreatic injury associated with drug doses and time points in HFD mice.
(A) 10 µg/mg exenatide, 12 weeks, acinar cell hypertrophy (white arrows) in association with autophagy (black arrows), and interacinar edema (white arrowheads). (B) 10 µg/mg exenatide, 12 weeks, several mitoses (white arrows) indicative of cell proliferation (hyperplasia). (C) 10 µg/mg exenatide, 12 weeks, acinar cell apoptosis (white arrowheads), necrosis (black arrowheads) and inflammatory edema (black arrows) in the interstitium. (D) 10 µg/mg exenatide, 12 weeks, vasculitis (white arrows) in association with interstitial inflammation and edema (black arrows). (E) 30 µg/mg exenatide, 12 weeks, severe interstitial inflammation and edema (black arrows) in association with acinar cell hypertrophy (white arrows) and ductal hyperplasia (black arrowheads). (F) 30 µg/mg exenatide, 12 weeks, the most complex pancreatic injury: mixture of a variety of acinar cell injuries (black arrows), ductal hyperplasia (white arrows), interacinar fibrosis (white arrowheads). (G) 30 µg/mg exenatide, 12 weeks, deposit of a protein-rich fluid (exudate) surrounding injured arterioles (black arrows) and ductal hyperplasia (white arrows). (H) 30 µg/mg exenatide, 12 weeks, increase in fibroblast proliferation (interstitial fibrosis; white arrows) and ductal hyperplasia (black arrows). A–H, X630, H&E stain.

