
Figure 2. geNorm stability analysis.
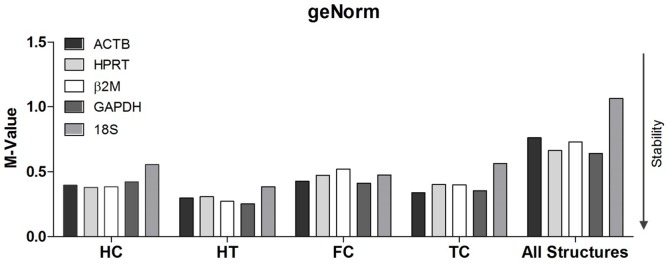
Evaluation of gene expression stability by geNorm for individual brain regions. All HKG candidates presented values that were lower than the cut-off value (1.5). HC, hippocampus; HT, hypothalamus; FC, frontal cortex; TC, temporal cortex.