
Figure 4. BestKeeper stability analysis.
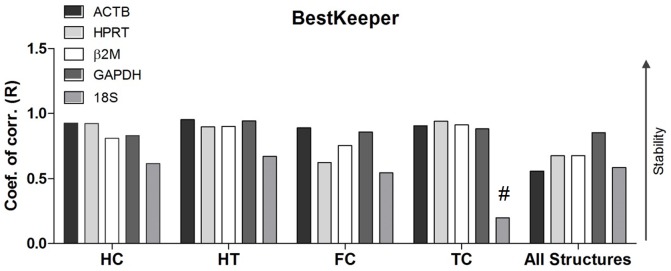
Evaluation of gene expression stability by BestKeeper for individual brain regions. The Pearson correlation coefficient (R) of all HKG candidates. All HKG except 18S in the temporal cortex, presented significant correlation (P<0.05), as determined by Pearson correlation analysis. #: P>0.05 HC, hippocampus; HT, hypothalamus; FC, frontal cortex; TC, temporal cortex.