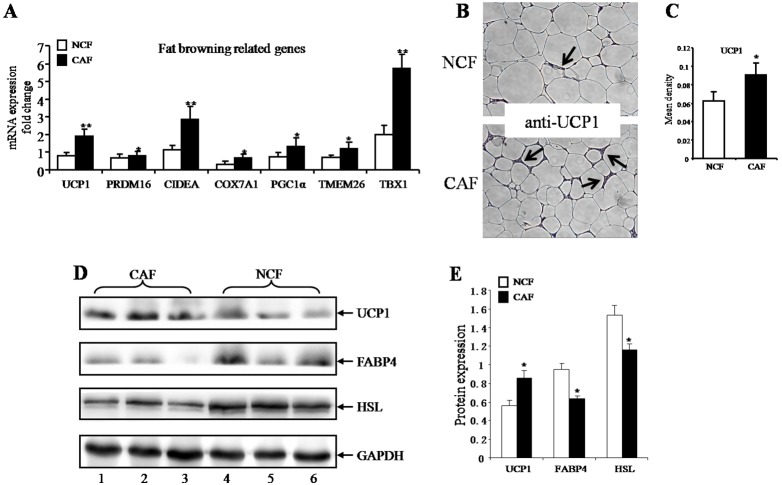
Figure 2. Browning of mammary fat from breast tumors and benign lesions.
(A) Quantitative RT-PCR analysis of mRNA expression of fat browning-related genes: UCP1, PRDM16, CIDEA, COX7A1, PGC1α, TMEM26 and TBX1 (mean±SEM; n = 30; *P<0.05, **P<0.01). (B) Immunohistochemically stained UCP1 sections of mammary fat from breast tumors (cancer associated fat, CAF) and from benign lesions (negative control fat, NCF). Black arrows point to UCP1 staining (magnification100×). (C) The mean densitometry of the digital image is designated as representative UCP1 staining intensity (indicating the relative UCP1 expression level). The mean density indicating the relative UCP1 expression level was higher in the CAF group (mean ± SEM; n = 6; *P<0.05). (D) Western blotting of mammary fat tissue protein from breast tumors and benign lesions. Lanes 1–3 from CAF and lanes 4–6 from NCF. (E) Bands were quantified using densitometric image analysis software. The relative expression of FABP4, HSL and UCP1 were normalized to that of GAPDH (mean ± SEM; n = 3; *P<0.05).

