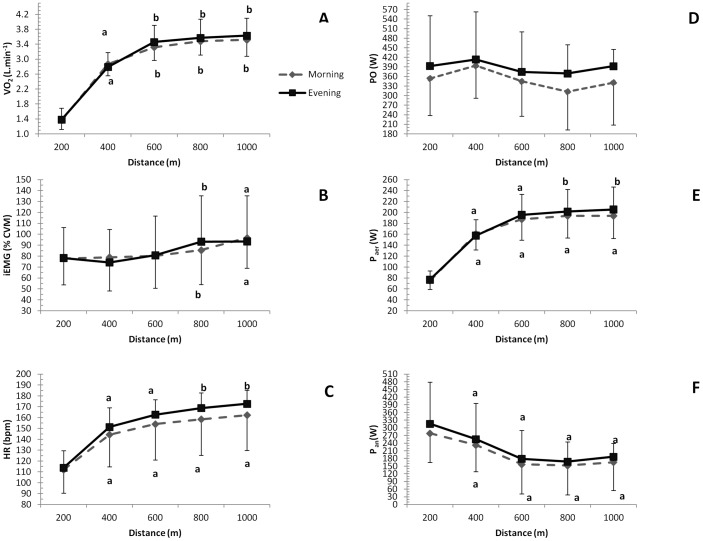
Figure 2. Mean and SD for oxygen uptake (A), integrated electromyography (B), heart rate (C), power output (D), aerobic power contribution (E), anaerobic power contribution (F) for each 200-m interval during the 1000-m cycling TT performed in the morning or in the evening.
a Significantly different than the 200-m value for the same time of day; b Significantly different than the 400-m value for the same time of day;  O2 and HR increased exponentially with distance for times of day (p<0.05), but there was a tendency for Paer values at 600 and 800 m, and
  O2 at 600 and 1000 m, to be higher in the evening than in the morning (p<0.10).

