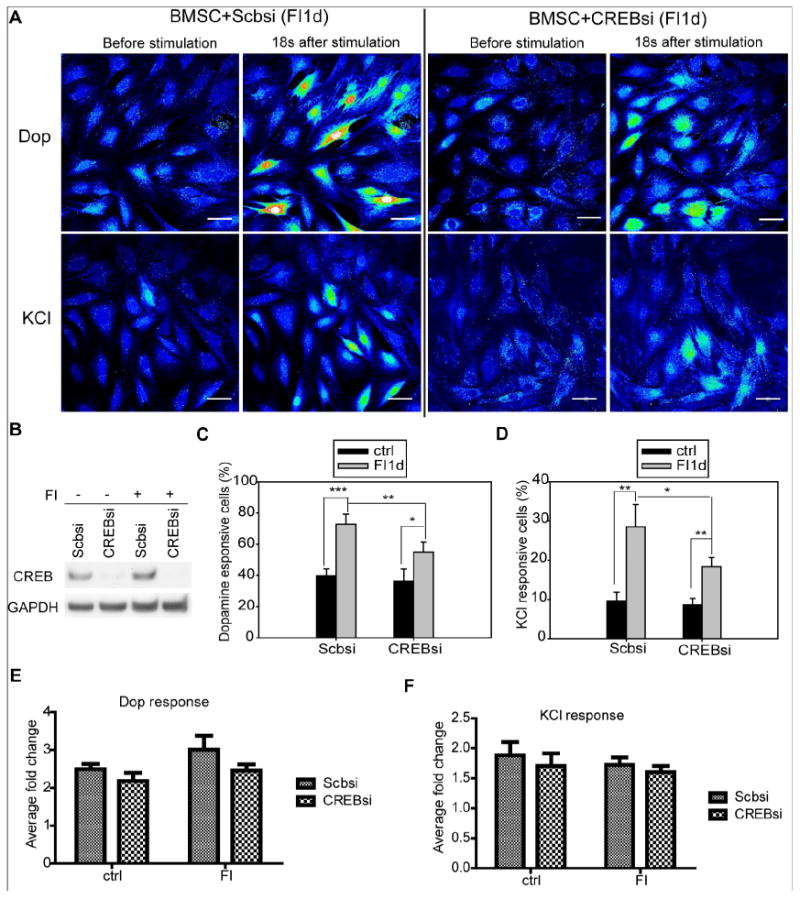
Fig. 2.

Calcium response to dopamine and KCl stimulation after silencing of CREB. (A) Calcium imaging in response to dopamine and KCl. BMSCs were transfected with scramble siRNA (Scbsi) or CREB siRNA (CREBsi) and induced with 10 μM forskolin and 100 μM IBMX (FI) for 1 day. Representative images before dopamine stimulation and 18 seconds after dopamine stimulation were presented. Fluorescence images were represented by a spectral table; warmer colors indicate higher fluorescence intensities (yellow to red) and cooler colors indicate lower fluorescence intensities (blue to green). Gain and offset are held constant in each experiment (before stimulation until the end of stimulation). Scale bar: 50 μm. (B) Protein levels of CREB for cells transfected with scramble or CREB siRNA and incubated in the absence (−) or presence (+) of FI. (C-D) Quantification of the percentage of cells responsive to dopamine (C) and KCl (D) (n=4). (E-F) Quantification of average fold change at peak intensity for cells responsive to dopamine (E) and KCl (F) (n=3). *: p <0.05, **: p <0.01, ***: p <0.001.
