Fig. 4.

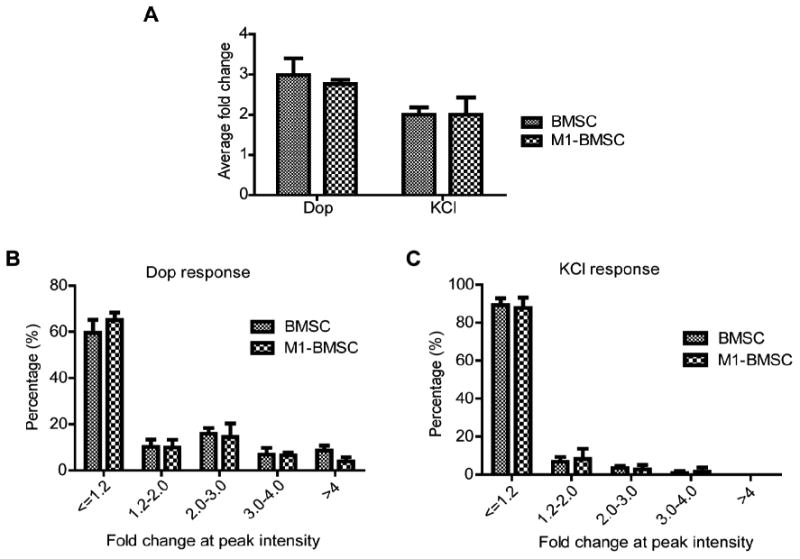
Quantification of fold changes of dopamine and KCl responsive cells. (A) Quantification of average fold change at peak intensity for cells responsive to dopamine and KCl in BMSCs and M1-BMSCs (n=3). (B) Distribution of dopamine responsive BMSCs and M1-BMSCs into different categories (<=1.2 (non-responsive), 1.2-2.0, 2.0-3.0, 3.0-4.0 and >4.0) based on the fold change at peak intensity (n=3). (C) Distribution of KCl responsive BMSCs and M1-BMSCs into different categories (<=1.2 (non-responsive), 1.2-2.0, 2.0-3.0, 3.0-4.0 and >4.0) based on the fold change at peak intensity (n=3).
