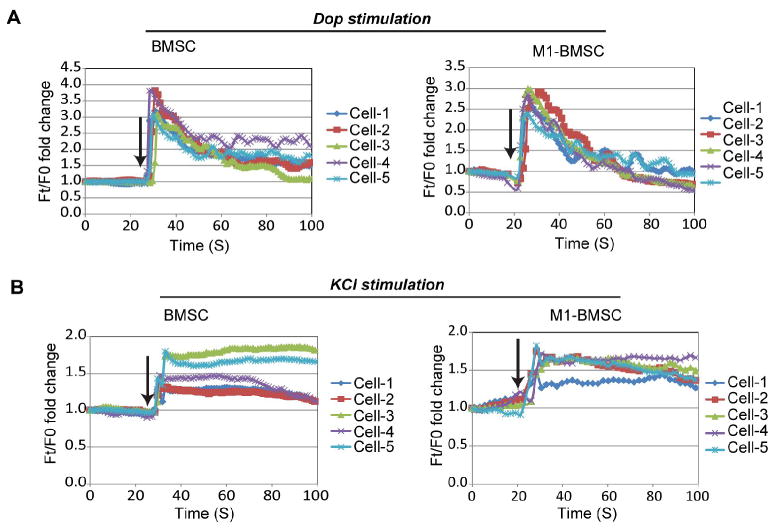
Fig. 5.

Fluorescence intensity profiles of uninduced BMSCs and M1-BMSCs stimulated by dopamine and KCl. (A) Fluorescence profile for five representative cells stimulated with 100 μM dopamine. Fluorescence intensity at time t (Ft) is normalized to fluorescence intensity at the starting point (F0). Arrows indicate the time of dopamine addition. (A) Fluorescence profile for five representative cells stimulated with 50 mM KCl. Fluorescence intensity at time t (Ft) is normalized to fluorescence intensity at the starting point (F0). Arrows indicate the time of KCl addition
