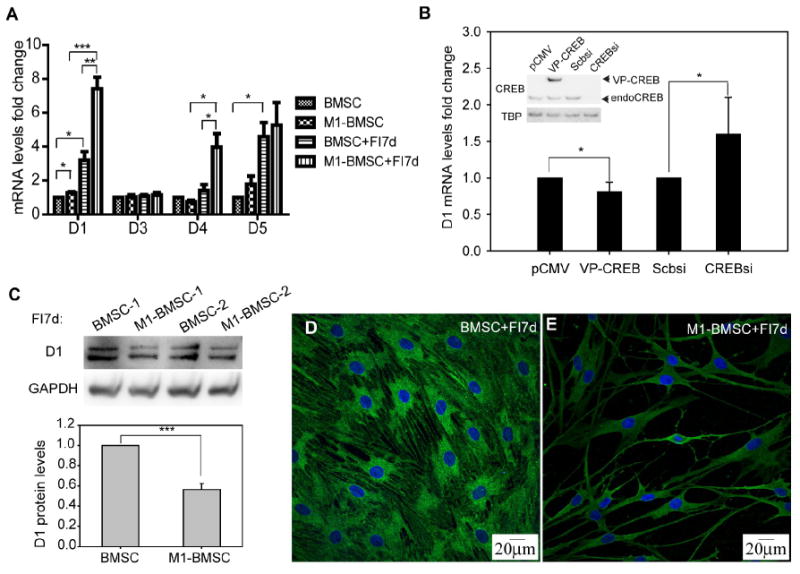
Fig. 8.

Expression of dopamine receptors. (A) mRNA levels of dopamine receptors D1, D3, D4 and D5 for control cells and cells treated with 10 μM forskolin and 100 μM IBMX (FI) for 7 days (n=3). BMSCs: expressing the control vector; M1-BMSCs: expressing M1-CREB. (B) D1 mRNA levels for BMSCs with CREB overexpression or silencing. CREB overexpression was achieved by transfection of the constitutively active VP16-CREB (denoted as VP-CREB) and silencing was achieved by CREB siRNA #1. pCMV and scramble siRNA were used as controls (n=5). The western blot insert in figure (B) indicates the overexpression and silencing results of CREB. Endogenous CREB is denoted as endoCREB. (C) Protein levels of dopamine receptor 1 (D1) for BMSCs and M1-BMSCs treated with FI for 7 days (n=3). (D) Dopamine receptor D1 staining for BMSCs. (E) Dopamine receptor D1 staining for M1-BMSCs. Green: D1 staining; blue: nucleus staining. *: p<0.05. **: p<0.01, ***: p<0.001.
