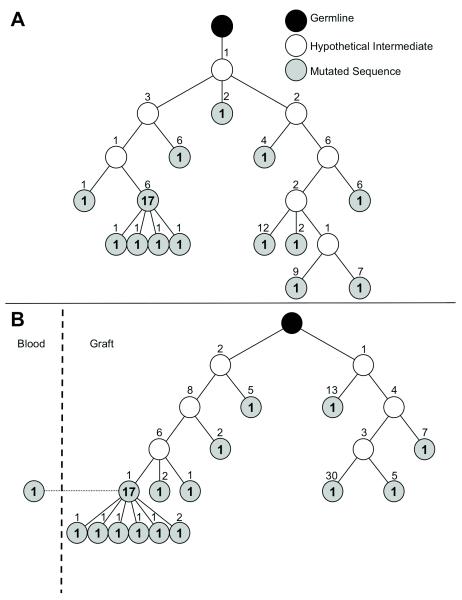
Figure 2. Phylogeny of expanded graft-infiltrating B cell clones.
Phylogenies were constructed using a Maximum-Likelihood method for the 2 most abundant graft infiltrating B cell clones in the IGHV2 family corresponding to the red and blue sections in Figure 1 VH2 graft pie chart. All sequences within each tree (A: n=30; B: n=31 in the graft and n=1 in the blood) shared the same identical CDR3 sequence, but differed by the presence of somatic mutations elsewhere. Each circle represents a distinct sequence that differs from the upstream neighboring sequence by the number of amino acid indicated above the circle. Bolded numbers in the circles indicate the number of occurrences of the corresponding sequence.

