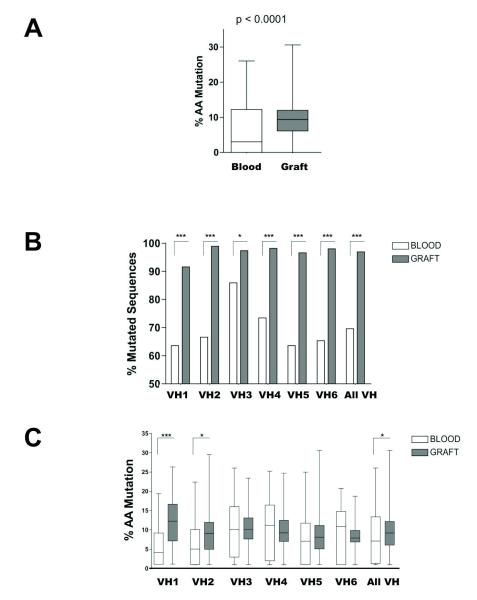
Figure 3. Comparative analysis of blood and intragraft B cell IGHV mutation rates.
A) Overall percentage of mutated residues within all sequences analyzed in the blood (N=413) and the graft (N=473) in patient 2. B) Percentage of mutated sequences at the amino acid level for the 6 IGHV families among all unique sequences found in the blood (N=362) and the graft (N=398) of patient 2. All sequences sharing the same clonotypic CDR3 motifs were counted once regardless of the number of occurrence). C) Percentage of mutated amino acids for the 6 IGHV families within all unique sequences found in the blood (N=252) and the graft (N=386) of patient 2. D) Percentage and distribution of silent and non-silent mutations for all unique sequences from the peripheral blood of patient 2 (N=252). E) Percentage and distribution of silent and non-silent mutations for all mutated sequences from the graft of patient 2 (N=386). [* p<0.05; *** p<0.0001]

