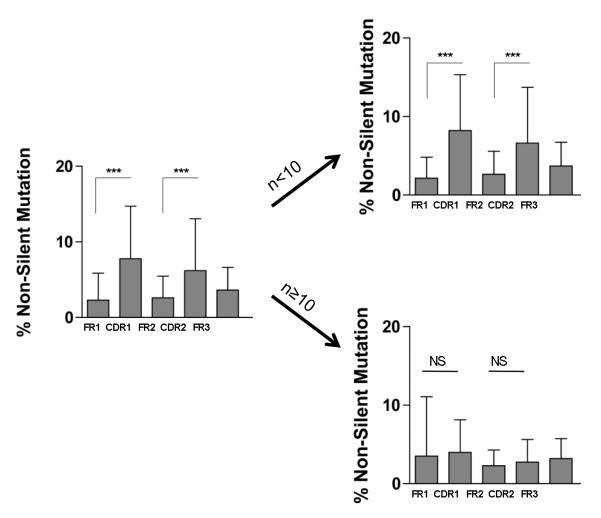
Figure 4. Comparative analysis of intragraft B cell IGHV non-silent mutations by VH segment.
Percentage and distribution of non-silent mutations for all analyzed mutated sequences (N=529) from the graft of patient 2 (VH1-VH6) and patients 5, 10, 17 and 19 (VH2). Sequences were analyzed together (left bar graph) or separately depending on their low or high frequencies in the IGHV repertoire (number of occurrences, n<10 or n≥10 respectively). [NS, non significant; *** p<0.0001]

