
Figure 6. Box and Whisker plot demonstrating median population change of cytokine levels from baseline for Eotaxin, IL-6 and TIMP-1 during treatment delivery, with 5th–95th centiles.
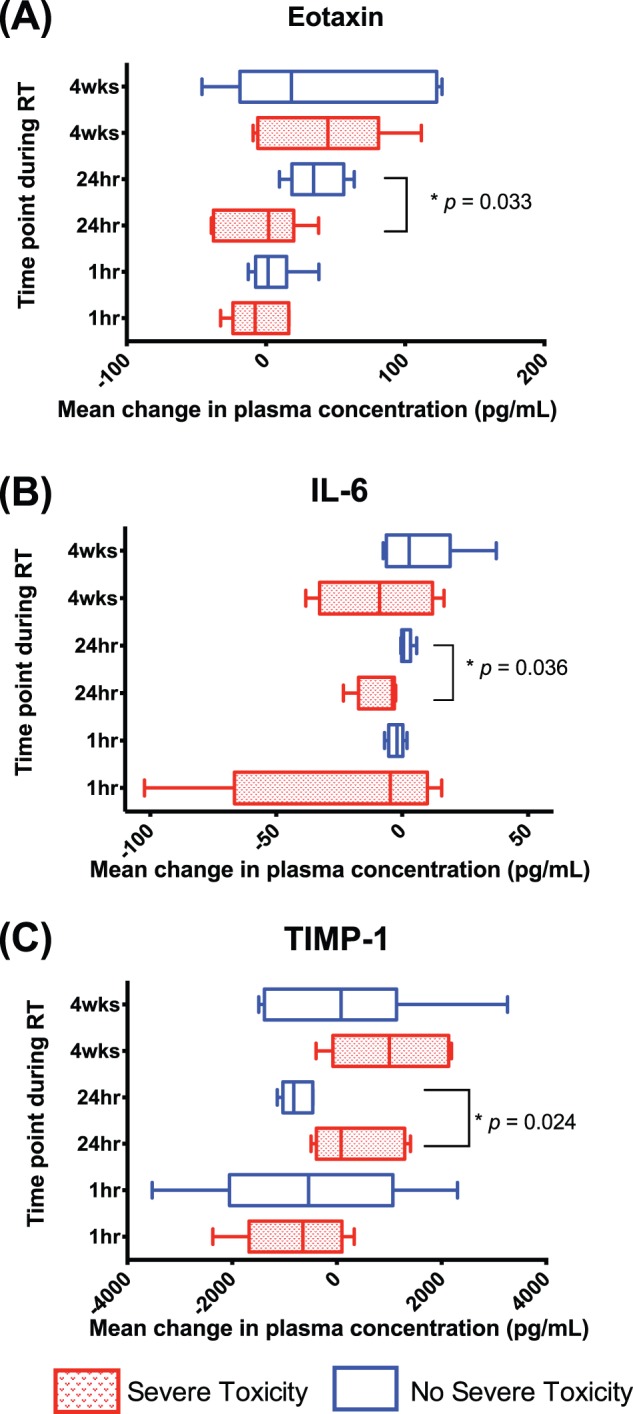
Statistically significant differences between patients with severe respiratory toxicities [shaded boxes] and those without [open boxes] are highlighted with associated p - values.