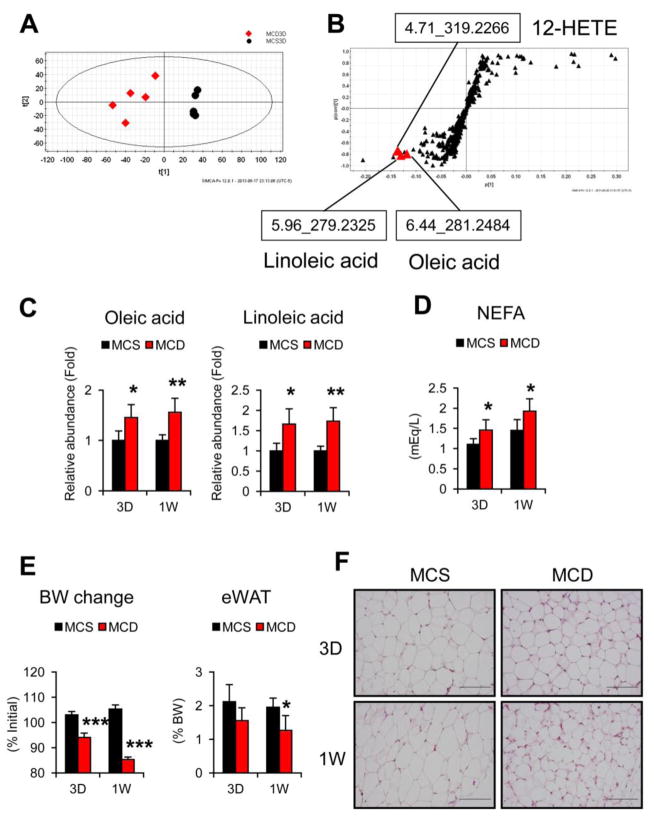
Fig. 1. Serum metabolomic analysis reveals significant increases in oleic and linoleic acids in early stage of MCD-NASH.
Male C57BL/6NCr wild-type mice at 8–12 weeks of age were fed a methionine- and choline-deficient diet (MCD) or control methionine- and choline-supplemented MCD diet (MCS) for three days or one week (n = 5/group).
(A) PCA of serum metabolites between mice treated with 3-day MCD (red diamond) and MCS (black circle).
(B) S-plot of OPLA analysis using the same data as (A). Retention time and molecular mass were indicated.
(C) Serum levels of oleic and linoleic acids. Values were normalized to those of MCS-treated mice in each time point and were expressed as relative abundance.
(D) Serum levels of NEFA.
(E) Body weight (BW) change and epididymal WAT (eWAT) weight. BW was measured just prior to killing and BW changes were expressed as the percentage relative to BW just before commencing the MCD or MCS treatment.
(F) Histology of epididymal WAT. Hematoxylin and eosin staining, Bar = 100 μm. Statistical analysis was performed using the Student’s t-test. *P<0.05, **P<0.01, ***P<0.001 vs. MCS-treated mice in the same time point.

