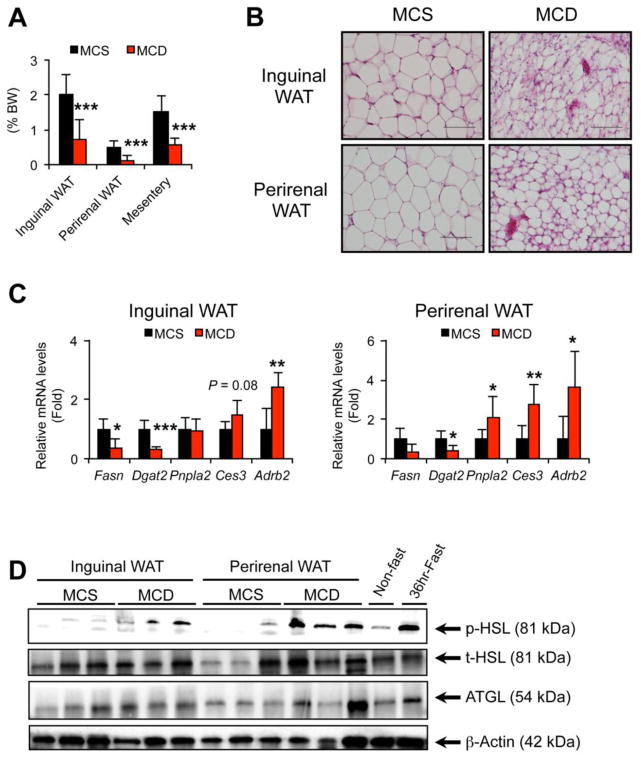
Fig. 3. The effect of MCD treatment on other WAT depots.
Male C57BL/6NCr wild-type mice at 8–12 weeks of age were treated with MCS or MCD for one week (n = 7–8/group) and inguinal WAT, perirenal WAT, and mesentery were harvested.
(A) The weights of inguinal and perirenal WAT and mesentery.
(B) Histology of inguinal and perirenal WAT. Hematoxylin and eosin staining, Bar = 100 μm.
(C) qPCR analysis. The mRNA levels were normalized to those of 18S ribosomal mRNA and subsequently normalized to those of MCS-treated mice. Statistical analysis was performed using the Student’s t-test. *P<0.05, **P<0.01, ***P<0.001 vs. MCS-treated mice.
(D) Immunoblot analysis of p-HSL, t-HSL, and ATGL. Cytosolic extracts of WAT (30 μg of protein) were loaded in each well. The band of β-actin was used as a loading control.

