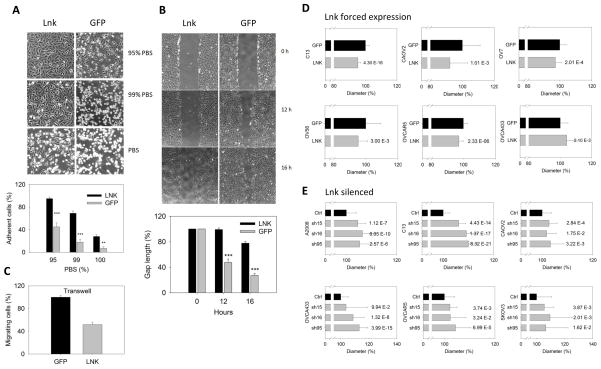
Fig. 5. LNK regulates cell adhesion, migration and cell size.
A. Overexpression of LNK renders cells more adhesive to tissue culture plate. Cell detachment was measured by replacing regular RPMI media with different ratios of PBS to RPMI, resulting in media with either 95 %, 99 % or 100 % PBS. Upper panel, photographs of cells taken 3 hours after media replacement; lower panel, graphic representation of data. B. Upper panel: representative images from wound healing experiments using confluent OVCA433 cells overexpressing either GFP or LNK. Pictures were collected at 0, 12 and 16 hours. Lower panel: graphic display of the size of the gap at 12 and 16 hours after ‘wounding’, expressed as a percentage of the gap of control at time zero. Results represent mean ± SD of 4 experiments. C. Transwell experiments of OVCA433 cells stably expressing either LNK or GFP. Cells migrating through the membrane were determined by MTT dye staining. Data are expressed as a percentage of migrating cells, expressed as a percent of control cells (48 hours), * p≤0.05; ** p≤0.01; *** p≤0.001. D. Overexpression of LNK reduces the cell diameter in a panel of ovarian cancer cell lines. Ovarian cancer cell lines with either forced expression of LNK or GFP controls were grown in similar, non-confluent conditions, trypsinized, centrifuged, resuspended in complete media and their cell diameters were measured using the Vi-CELL Cell Viability Analyzer (Beckman). E. Silencing of the LNK enlarges the diameter of ovarian cancer cell lines. Ovarian cancer cell lines which were stably expressing shRNA targeted either to LNK (5715, 5716 and 6095) or non-target shRNA as control (Ctrl), were collected and their cell diameters were measured. For each cell line, 500~2,000 cells were measured to generate the mean value of the cell diameter. Significance was calculated by paired student t-test; and the P values are indicated after each bar.

