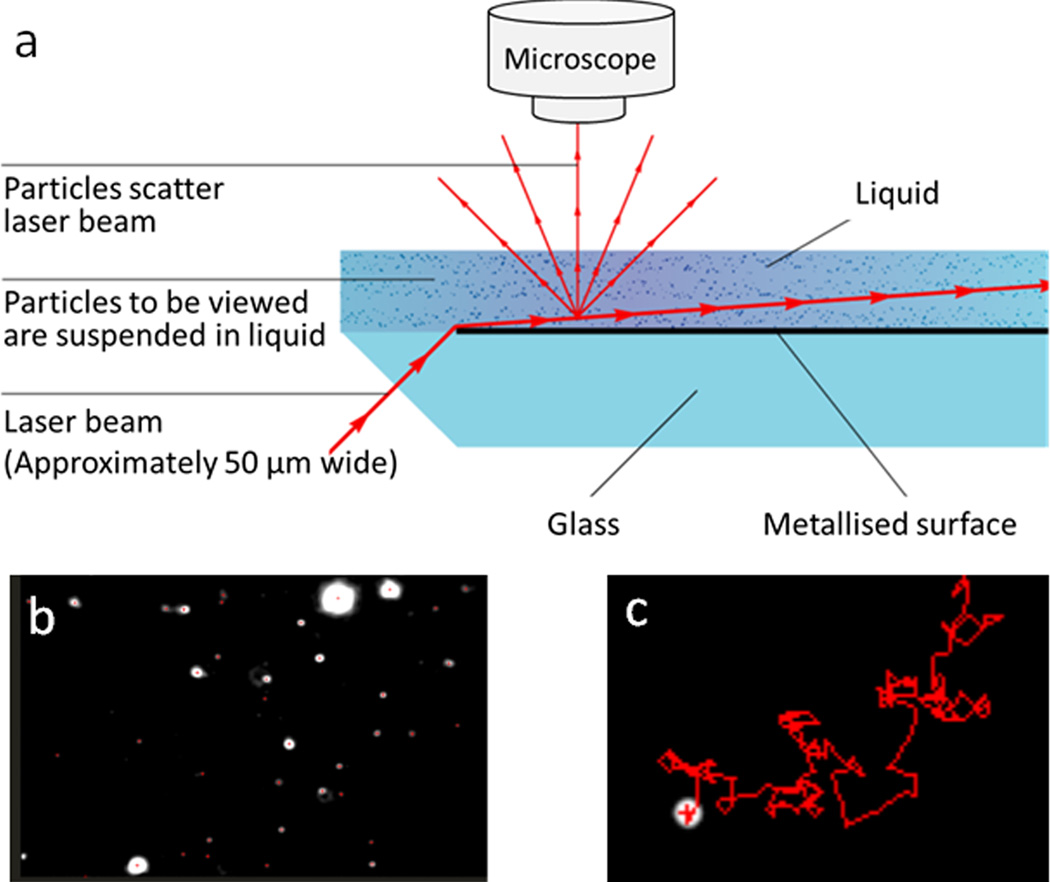
Figure 6.
Illustration of the nanoparticle tracking analysis (NTA) system, adapted from ref. 49, with permission from Nanosight Ltd. (a) Scheme of Nanosight configuration. (b) One frame from a video captured by Nanosight; each bright spot represents one nanoparticle in liquid. (c) Typical moving motion of one nanoparticle tracked by NTA software.

