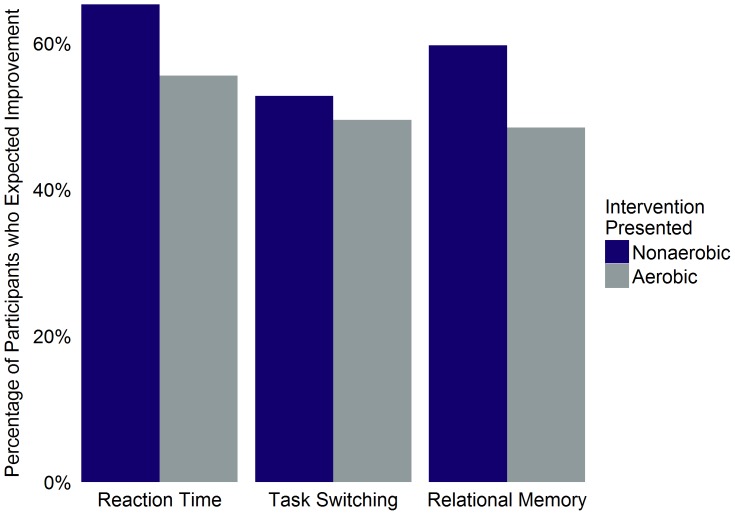
Figure 1. Percentage of participants expecting improvement as a function of intervention group and task for all participants.
Percentage of participants within each intervention group who believed that completion of the intervention presented to them would improve task performance. Includes both sedentary and non-sedentary participants.

