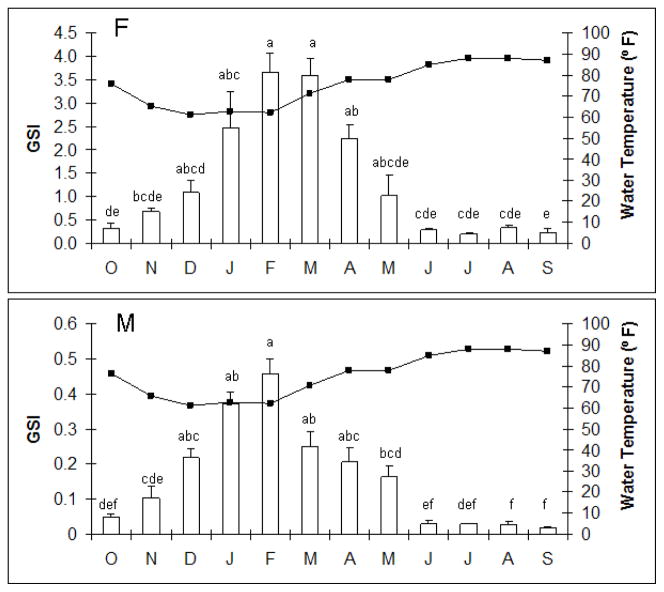
Figure 3.
Gonadosomatic index (bars) throughout the year of female and male largemouth bass in the St John’s River near Welaka, FL. Statistical differences in GSI across months are indicated by different letters as determined by ANOVA followed by a Tukey’s HSD post hoc test. P < 0.05 was considered significantly different. Average water temperature (line graph) in the St Johns River over a 1-year period (October, 2005-September 2006) is shown.

