
Figure 5.
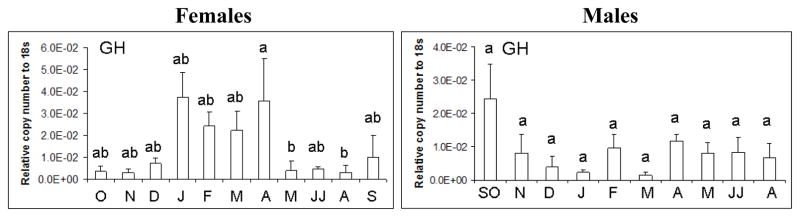
GH mRNA expression in female and male largemouth bass pituitary as determined by real-time PCR. Each bar represents the mean copy number of the gene ± S.E.M of untransformed data followed by ANOVA with a Tukey’s post hoc test (n=3–8/month/sex). Each calculated gene copy number is divided by 18s copy number and is a relative copy number on the y-axis. Both female and male expression data in June and July (JJ) were combined in the analysis as was the case for September and October males (SO). Different letters indicate statistical differences among groups (p<0.05).