
Figure 7.


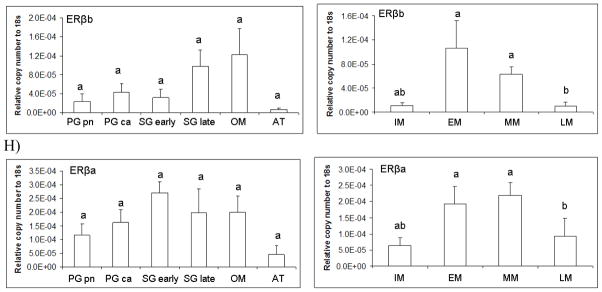
Pituitary transcript abundance in relation to largemouth bass gonad phase. Each bar represents the mean copy number of the gene ± S.E.M. of untransformed data followed by ANOVA with a Tukey’s post hoc test (n=3–15/stage). Each calculated gene copy number is divided by 18s copy number and is a relative copy number on the y-axis. Abbreviations for female phases are as follows; Primary growth perinuclear (PG pn); Primary growth cortical alveoli (PG ca); Secondary growth early (Sg early); Secondary growth late (Sg late); Oocyte maturation (OM); and Atresia (AT). Graphs are A) LHβ mRNA female and male; B) FSHβ mRNA female and male; C) GTHα mRNA female and male; D) GH mRNA female and male; E) ERα mRNA female and male; F) ERβb mRNA female and male; and G) ERβa mRNA female and male. Sample sizes for female pituitaries according to gonad stage were as follows; PG pn (n=8), PG ca (n=8), SG early (n=5), SG late (n=9), OM (n=5), and AT (n=2). Number of females that were staged and used in the stage specific analysis was n=. Sample sizes for male pituitaries according to gonad stage were as follows; IM (n=5), EM (n=4), MM (n=22), and LM (n=6). Number of males that were staged and used in the stage specific analysis was n=37. Different letters indicate statistical differences among groups (p<0.05).