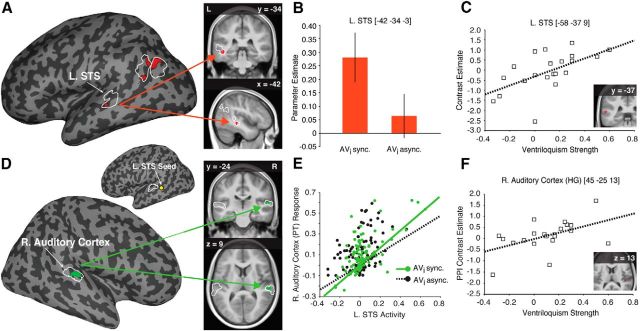
Figure 3.
Neural basis of imagery-induced ventriloquism. A, Activity associated with audiovisual synchrony (vs asynchrony) for imagined visual stimuli within the functionally defined multisensory regions of interest (fROIs outlined in white) overlaid on a representative inflated cortical surface (left); coronal and sagittal sections displaying the peak activation in the L. STS is overlaid on the average normalized anatomical image from our participants (right). The activity differences observed in the parietal cortex were the result of deactivations, i.e., less activity for synchronous auditory and imagined visual stimuli compared with the resting baseline (see Results). B, Bar plot shows the parameter estimates from the significant peak of activation in the L. STS; error bars denote ±SEM. C, Post hoc multiple-regression analysis demonstrating that the activity in the L. STS in the AVi synchronous [Avi sync.; vs AVi asynchronous (Avi async.)] condition could be predicted by the strength (i.e., the difference of AVi synchrony and AVi asynchrony ventriloquism indices) of the imagery-induced ventriloquist effect. D, Significant enhanced connectivity between the right auditory cortex and the L. STS seed region for the AVi synchronous (vs AVi asynchronous) condition overlaid on a representative inflated cortical surface (bottom left). A yellow circle marks the approximate location of the L. STS seed on an inflated left hemisphere cortical surface (top left; fROIs outlined in white). Coronal and axial sections displaying the peak connectivity to the right auditory cortex are overlaid on the average anatomical image from our participants (right). E, Plot of the PPI for one representative subject showing a steeper regression slope relating L. STS activity to the response magnitude of the right (R.) auditory cortex during the AVi synchrony (AVi sync., green) compared with the AVi asynchrony condition (AVi async., black). F, Post hoc multiple-regression analysis demonstrating that effective connectivity from L. STS to the right (R.) auditory cortex in the AVi synchrony (vs AVi asynchrony) condition could be predicted by the strength of the imagery-induced ventriloquist effect. Activation maps are displayed at puncorrected < 0.01 for display purposes only.

