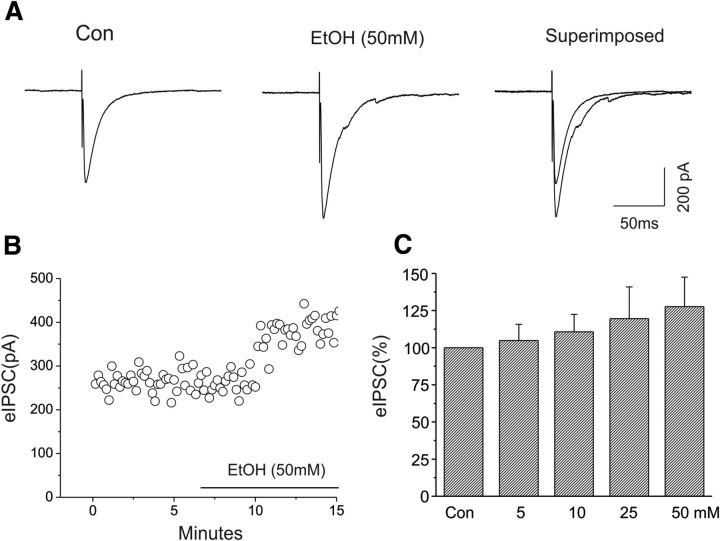
Figure 3.
Enhancement of the amplitude of eIPSCs of CeA neurons by ethanol (50 mm). A, Representative traces of eIPSCs at the holding potential of −70 mV before and after ethanol application. In this neuron, 50 mm ethanol increased the amplitude of eIPSCs by 30% over baseline. B, Time course of the peak amplitude of eIPSCs during control and bath application of ethanol. C, Bar graph showing the mean change in the peak amplitude of eIPSCs after bath applications of 5 (n = 7), 10 (n = 5), 25 (n = 5), and 50 mm (n = 7) ethanol (F(3,20) = 25.1; p < 0.001, one-way ANOVA).

