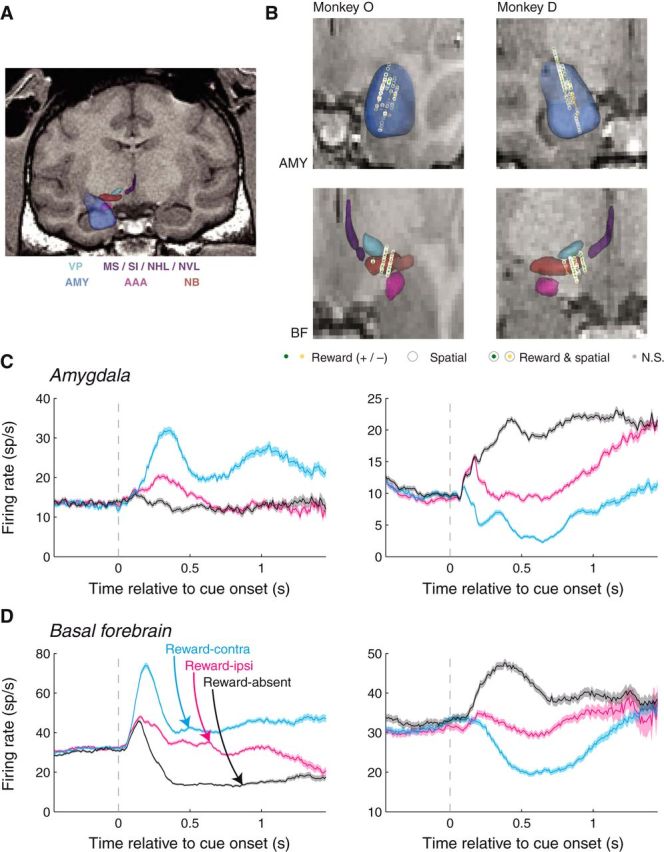
Figure 2.

MRI reconstruction of recording sites and individual neuron firing rates. A, Sample coronal slice from Monkey D with overlaid 3D reconstructions of the brain areas of interest, as well as nearby brain areas. Light blue: ventral pallidum (VP); purple: medial septal nucleus (MS), substantia innominata (SI), nucleus of the horizontal limb of the diagonal band (NHL), and nucleus of the vertical limb of the diagonal band (NVL); blue: amygdala (AMY); magenta: anterior amygdaloid area (AAA); brown: nucleus basalis (NB). B, Recording locations within the amygdala (top) and BF (bottom) for the two monkeys. Plot style indicates the significance of selectivity for individual sites (see legend). C, D, Amygdala and BF neurons respond selectivity to cues depending upon their reward association and spatial configuration. Firing rates as a function of time relative to cue onset for example amygdala (C) and BF (D) neurons. For each example (SUA) site, both the reward prediction and spatial configuration of the cues had a significant influence on firing rates (Wilcoxon, p < 0.05; left, reward and spatial selectivity indices > 0.5; right, reward and spatial selectivity indices < 0.5).
