Figure 3.
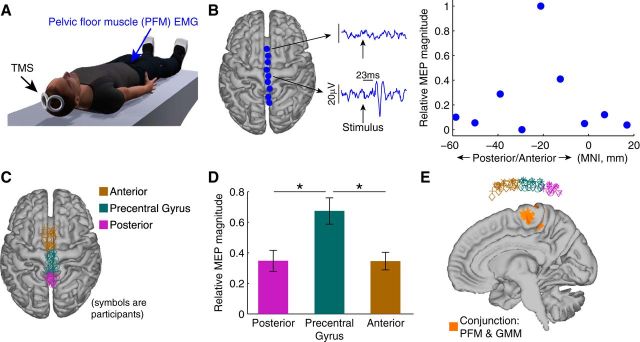
TMS evidence that region of brain activation overlap between voluntary PFM activation and voluntary GMM activation is associated with the activity in PFM muscles. A, We collected MEP from the PFM muscles generated by TMS along the midline of the participant's brain. B, Single participant data showing an MEP in the PFM muscles generated by stimulating over precentral gyrus at a latency of 23 ms. Stimulating at points not over the precentral gyrus did not generate significant MEPs. The MEP in the PFM peaked at an MNI coordinate at approximately −20 mm. C, Locations of applied stimulation across all participants confined over the midline and divided (binned) into posterior, middle (precentral gyrus), and anterior bins. D, ANOVA analysis revealed that bin location had a significant main effect on MEP magnitude (*p = 0.003). MEPs corresponding to the middle bin were significantly greater than either the posterior bin (p = 0.001) or anterior bin (p = 0.016). Error bars indicate SEM across participants. E, Stimulation points classified as precentral gyrus were above the fMRI-identified region of activation common to both voluntary PFM activation and voluntary GMM activation.

