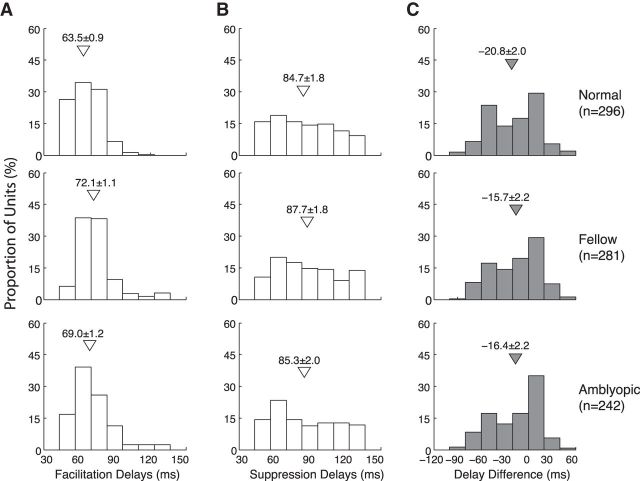
Figure 7.
Differences in optimal correlation delays (‘latency’) between the facilitatory and suppressive subfields in V2 neurons from normal monkeys (top), those driven by the fellow eye (middle), and amblyopic eye (bottom). A, Distribution of the correlation delays (latency) for facilitatory subfields. B, Distribution of the optimal correlation delays for suppressive subfields. C, Differences in the distribution of optimal correlation delays between facilitatory and suppressive profiles. Open triangles indicate means (±SE).

