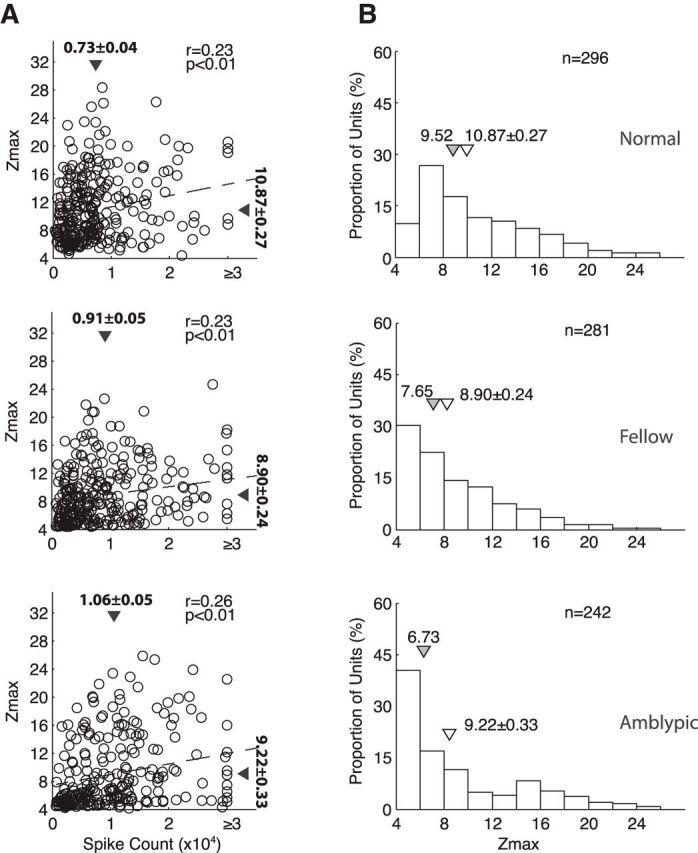
Figure 9.

A, Scatter plots relating the Z-max score of each neuron with its spike count. Triangles indicate mean (±SE). B, Frequency distributions of Z-max scores of V2 neurons from normal monkeys (top), those driven by the fellow eye (middle), and those driven by the amblyopic eye (bottom). Filled triangles indicate median values and open triangles show mean values (±SE).
