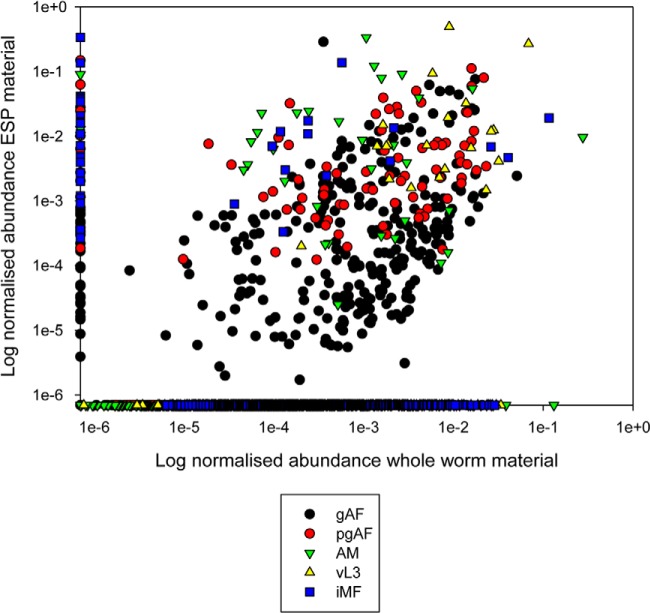
Fig. 4.
Relative abundance of L. sigmodontis ESP proteins compared with corresponding WBE. ESP proteins (≥2 peptides detected at p < 0.05 and <1% FDR, present in ≥2 biological replicates) were quantified by ion intensity (iBAQ) and compared with the iBAQ abundance of the same protein present in nematode WBE (x axis). Individual abundance values were normalized by dividing by the summed total abundance of that individual sample (life stage). The normalized abundance ratio was used as a guide to evaluate the enrichment of the protein. Note that as the data are normalized within each life stage, direct comparisons of abundance between them is not valid.

