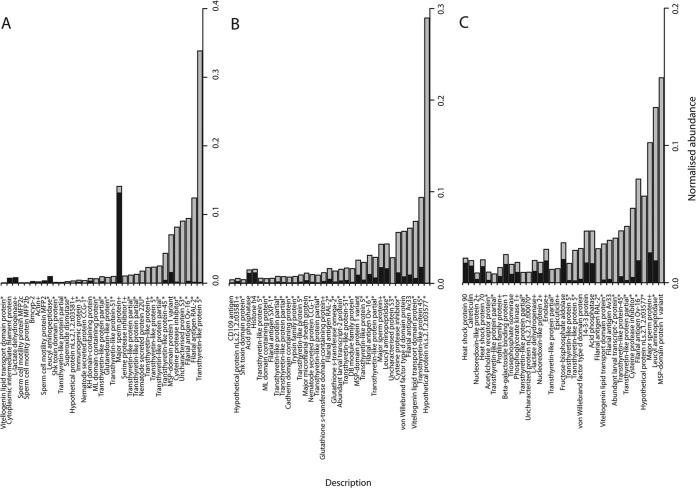
Fig. 5.
Comparison of ESP protein abundance (iBAQ) in adult stages of L. sigmodontis. The top 35 most abundant proteins in each ESP (A, AM; B, gAF; C, pgAF) are ranked by normalized iBAQ abundance (gray bars); the corresponding abundance in WBE is displayed for comparison (black bars) in stacked format. Individual protein abundance values were normalized by the summed total abundance per sample. An asterisk indicates proteins with a predicted signal peptide, whereas predicted secretion through the nonclassical pathway is indicated by a plus sign.

