
Fig. 4.
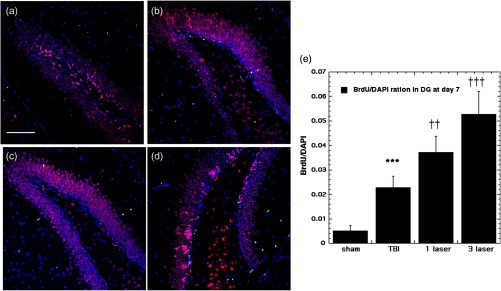
BrdU-NeuN double-staining images and analyses at the neurogenic hippocampal DG at the 7 days point; (a) sham, (b) CCI-TBI, (c) tLLLT, (d) tLLLT, (e) mean BrdU/DAPI (); normalization of the readings was done BrdU versus DAPI (labeling the nuclei). Scale bar . *** versus sham; ††, ††† , 0.001 versus TBI.