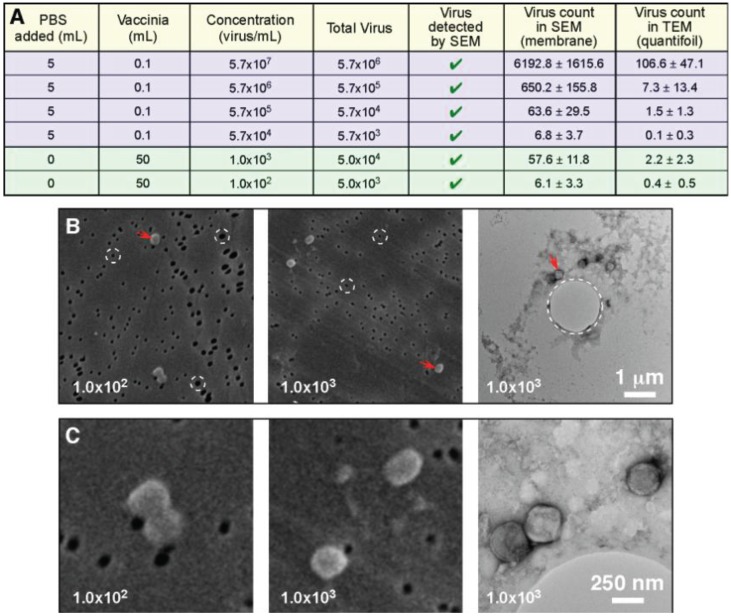
Figure 6.
Total particle count and not concentration determine the ability to detect a pathogen. (A) The data from Figure 5 (blue: 0.1 mL sample volume) has been presented to include the total virus present in the samples; This data has been supplemented by two additional samples that were extremely low concentration, but were considerably larger sample volumes (green: 50 mL sample volume); Low magnification (B), and higher magnification images (C) clearly demonstrate the ability to detect the low concentration pathogens by both TEM and SEM; In (B) we have high-lighted the pores in both of the support filters/films (circles with white dashed lines). The SPI-pore filter pores are ~80 nm and do not permit vaccinia to pass through, whereas the ~1 µm pore in the quantifoil support film can permit passage of the vaccinia.

