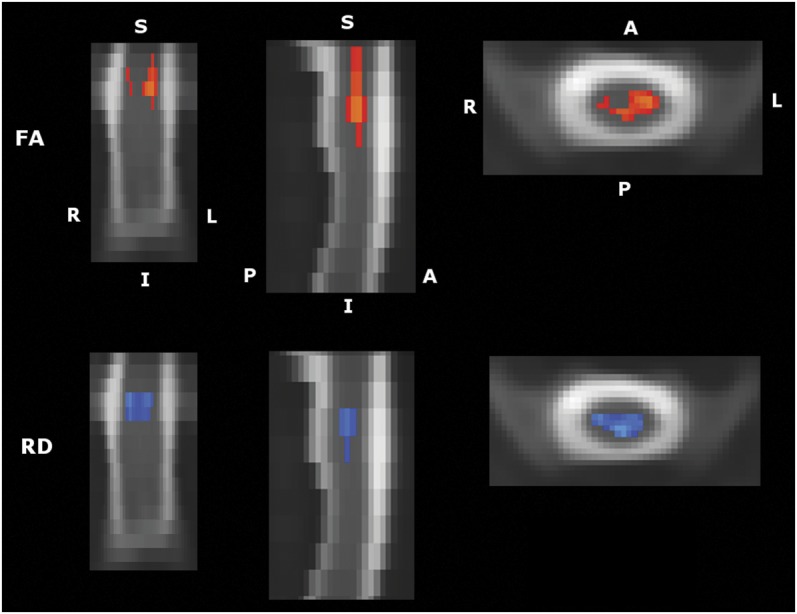
Figure 1. Differences in diffusion parameters between patients and controls.

Significant differences in FA and RD between patients (n = 11; 6 females; mean age 35.5 ± 8.2 years) and healthy controls (n = 10; 6 females; mean age 44 ± 12.2 years). The cervical region with significant differences between patients and controls are shown. Clusters are shown in coronal, sagittal, and axial views, viewed from left to right, respectively. Significance is taken at p < 0.01, uncorrected. A = axial; FA = fractional anisotropy; I = inferior; L = left; P = posterior; R = right; RD = radial diffusivity; S = superior.
