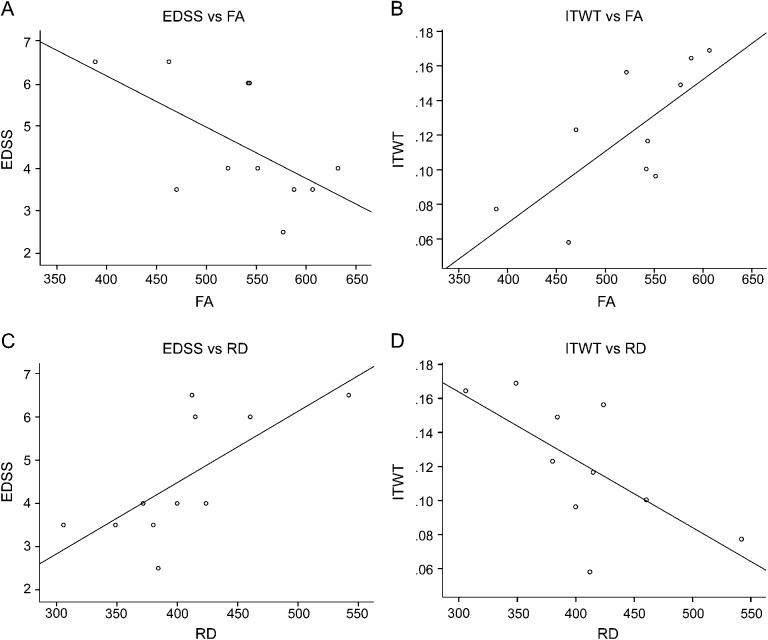
Figure 2. Significant correlations between diffusion and clinical metrics.
(A) Relation between FA and EDSS (R = −0.605; p = 0.049). (B) FA and iTWT (R = 0.721; p = 0.019). (C) Relation between RD and EDSS (R = 0.744; p = 0.009). (D) RD and iTWT (R = −0.624; p = 0.054). EDSS = Expanded Disability Status Scale; FA = fractional anisotropy; iTWT = inverse of Timed 25-Foot Walk Test; RD = radial diffusivity.

