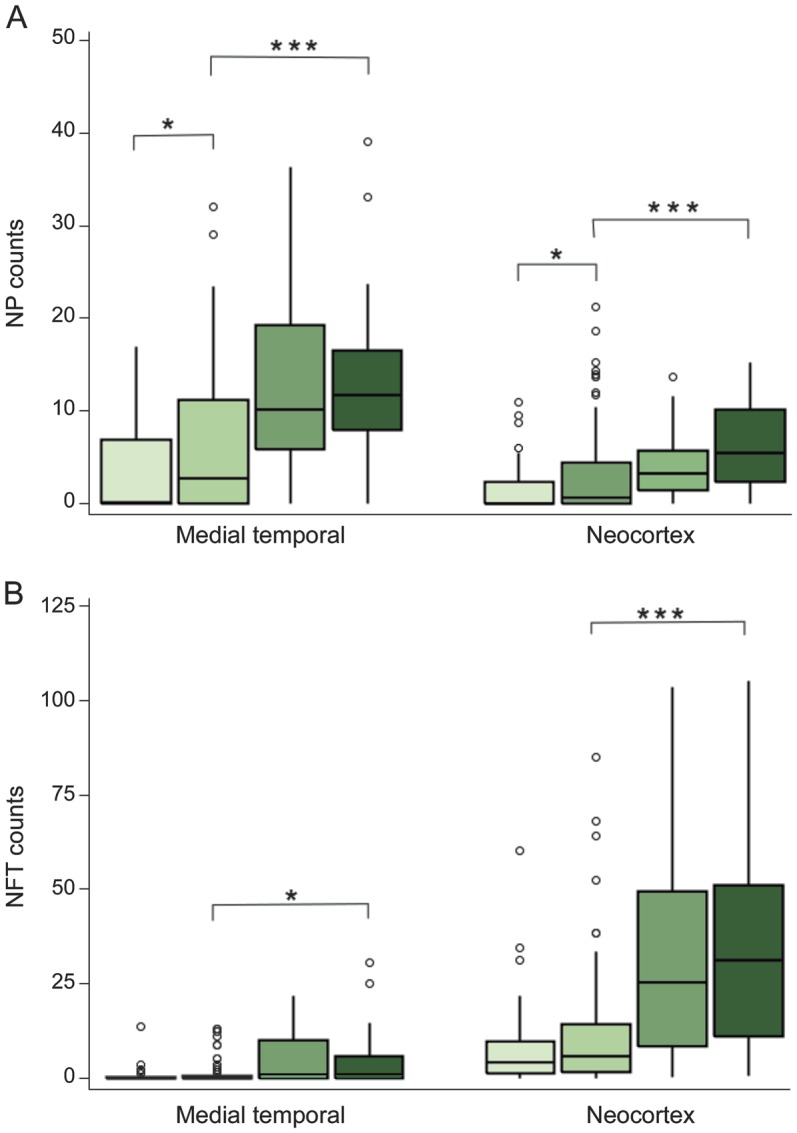
Figure 2. Boxplots of neuritic plaque counts and neurofibrillary tangle counts in 2 brain regions.

The boxplots provide neuritic plaque (NP) (A) and neurofibrillary tangle (NFT) (B) counts for each of 4 groups (in order and shaded light to dark): subjective memory complaint (SMC) negative and impaired negative; SMC positive and impaired negative; SMC negative and impaired positive; and SMC positive and impaired positive. *p < 0.05, ***p < 0.001.
